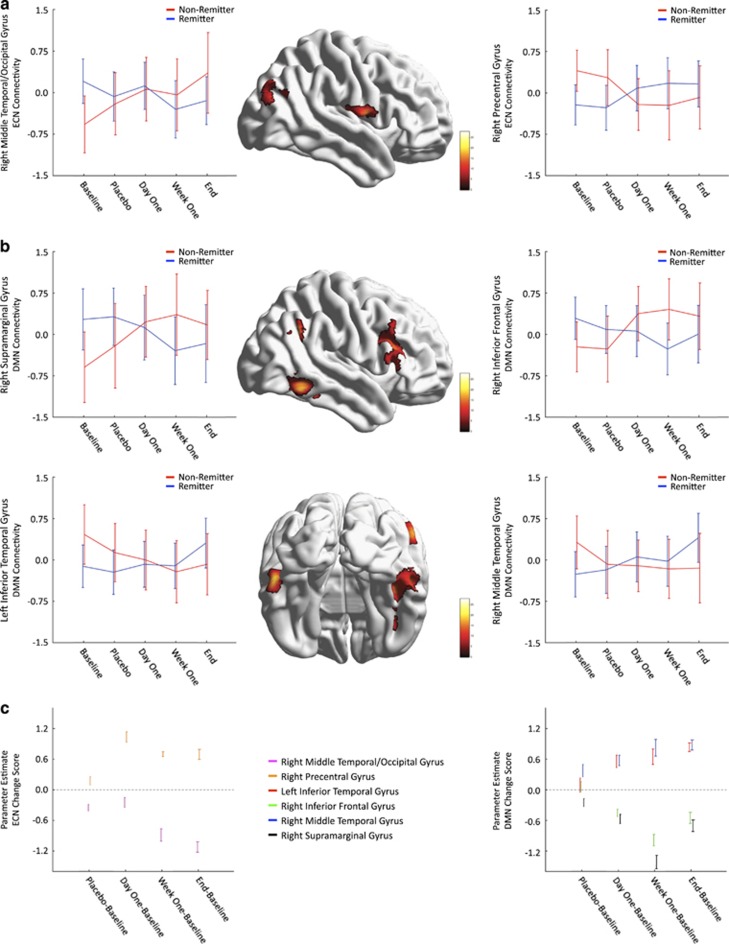
Figure 2.
Connectivity changes where the interaction (group × time) was significant. (a) ECN connectivity changes that were significant. (b) DMN connectivity changes that were significant. For a and b, non-remitters are shown in red color and remitters are shown in blue color. The color bar indicates the value of the F-statistic. Error bars represent the 99% CIs. (c) Change score analysis results. Different regions are shown as different colors. The values represent mean and 99% CIs for the parameter estimate that tested whether there was a significant difference between remitters/non-remitters in the change scores (placebo/day 1/week 1/end−baseline). Dotted line represents β-estimate of zero. DMN, default mode network; ECN, executive control network.

