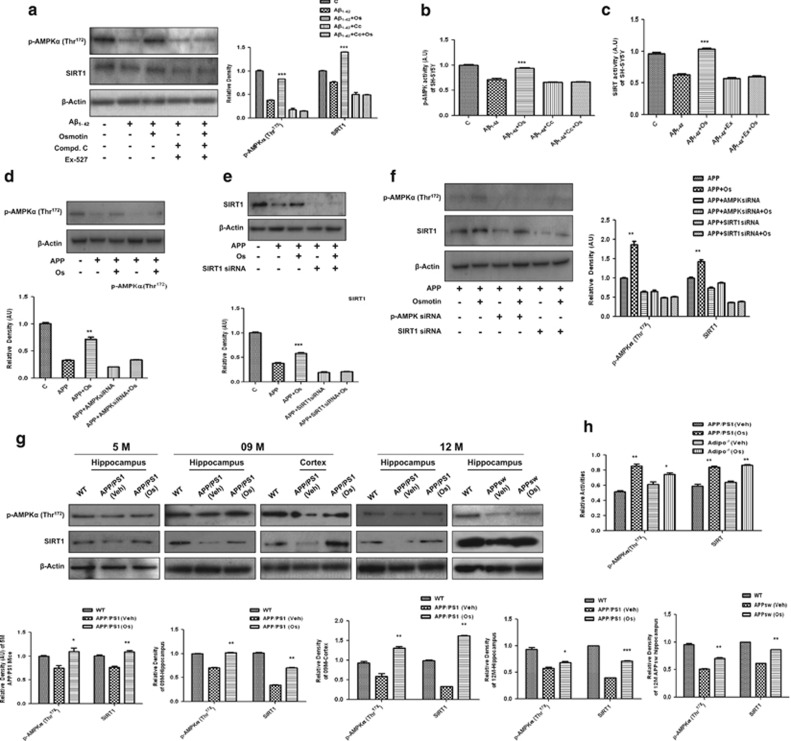
Figure 1.
Osmotin increased phosphorylated AMP-activated protein kinase (p-AMPK) and sirtuin 1 (SIRT1) levels and their activities in vitro and in vivo. (a) Western blot analysis of p-AMPK and SIRT1 in lysates of SH-SY5Y cells after treatment with Aβ1–42 (5 μM), osmotin (Os; 0.2 μM), compound C (C; 20 μM) and EX527 (80 μM) for 24 h and (b, c) their activity histograms. (d–f) Western blot analysis with the respective density histograms of p-AMPK and SIRT1 in lysates of APPswe/ind-transfected (for 72 h) SH-SY5Y cells subjected to the small interfering RNA (siRNA)-induced silencing of AMPK and SIRT1 for 48 h, respectively, after 24 h of treatment with Os (0.2 μM). (g) Western blot analyses of p-AMPK and SIRT1 levels in hippocampal extracts from 5-, 9- and 12-month-old wild-type (WT) and vehicle (Veh)- or Os-treated (for a short time) amyloid precursor protein/presenilin 1 (APP/PS1) and APPSW mice and (h) AMPK and SIRT activity histograms in brain homogenates of Adipo−/− and APP/PS1 mice. The assays were performed three times with similar results, and representative data from one experiment with triplicate samples are shown. The bands were quantified using Sigma Gel System (SPSS, Chicago, IL, USA), and their differences are presented as histograms derived from a one-way analysis of variance (ANOVA) followed by a t-test and as the mean±s.e.m. for the respective indicated proteins (n=5/group). After developing of respective antibodies, membranes were reprobed for the β-actin signal, shown as the loading control. Histograms depict analyses of band density relative to the density of WT on the same blot. Significance: *P<0.05, **P<0.01 and ***P<0.001.

