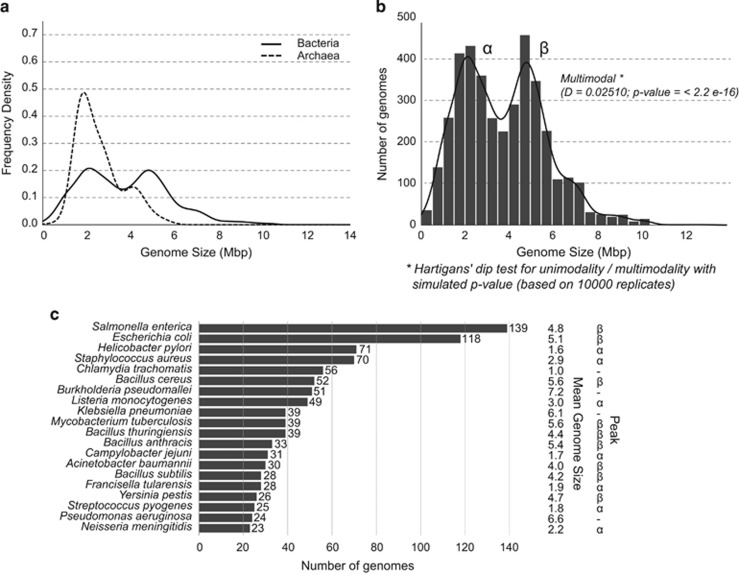
Figure 1.
(a) Distribution of genome sizes in bacteria and archaea: the curves were generated by Gaussian–kernel smoothing of the individual data points. The figure has a very similar pattern to the figure generated by Koonin and Wolf, 2008. The distribution of archaea was included for comparison only. (b) Distribution of genome sizes in bacteria on a different scale: the distribution shows clear-cut bimodality. Hartigans' dip test for unimodality/multimodality with simulated P-value with 10 000 Monte Carlo replicates: D=0.02510, P<2.2e−16, where values <0.05 indicate significant bi- or multimodality and values >0.10 indicate unimodality (Freeman and Dale, 2013). (c) Number of genomes from the top 20 most redundant species in the database with mean genome size and peak in which they belong. (Peak α: 1.5–3 Mbp, Peak β: 4–5.5 Mbp). The top 20 most redundant species belonged to 971 genomes representing almost 25% of the entire dataset. Most of them (18 species in total) formed part of the peaks (α and β), including the top 4 species, namely Salmonella enterica, Escherichia coli, Helicobacter pylori and Staphylococcus aureus.

