Figure 2.
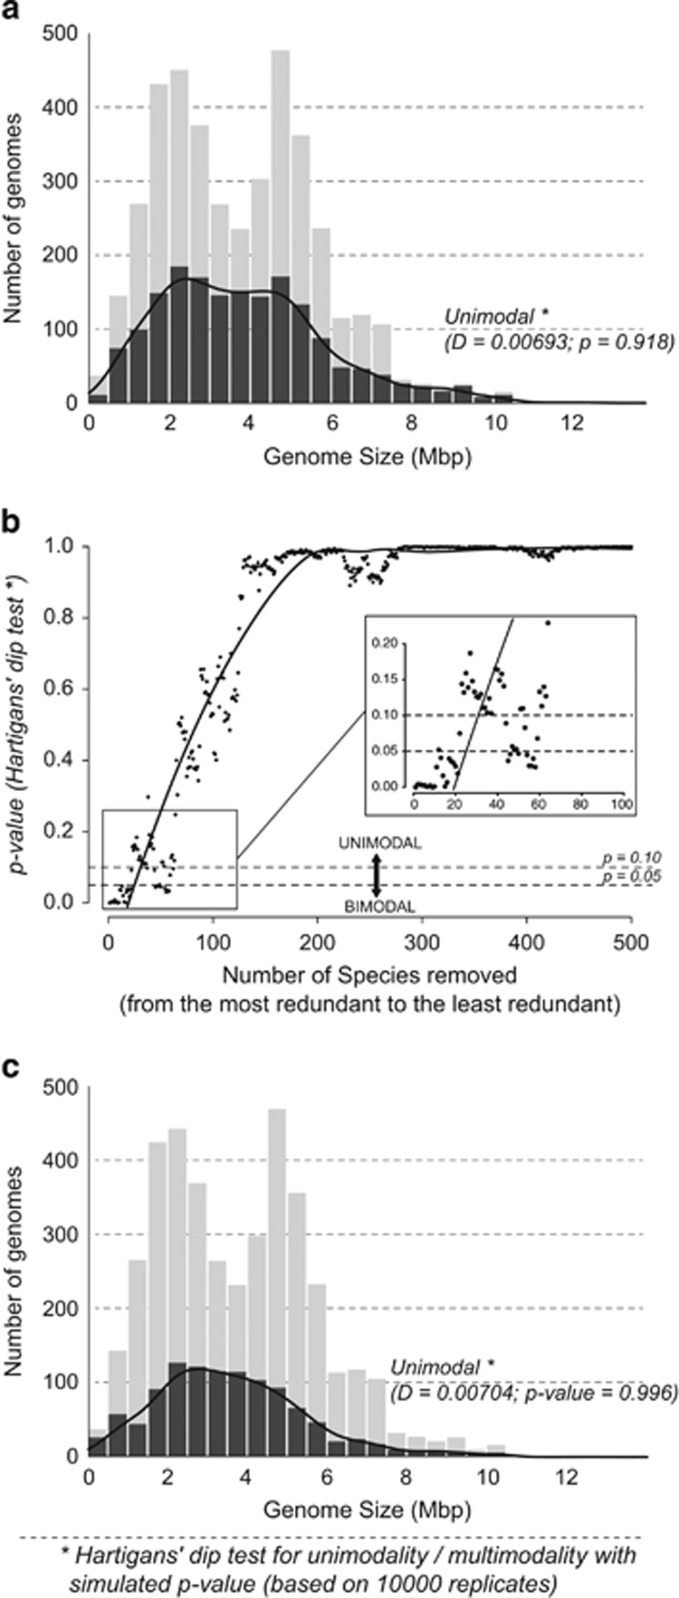
(a) Distribution of genome sizes in bacteria after removing redundant genomes. The grey area indicates 2217 redundant genomes (out of 3923 genomes in total). The distribution indicates unimodality (Hartigans' dip test: D=0.0069289, P=0.908). (b) Effect of removing 500 most redundant species from the database on the modality of distribution measured by Hartigans' dip test. After removing around 60 most redundant species, the distribution becomes mostly unimodal. (c) Distribution of genome sizes in bacteria after removing redundant and very closely related genomes using 16S rRNA (2841 genomes). The distribution shows a clear-cut unimodal distribution (Hartigans' dip test: D=0.0070418, P=0.996).

