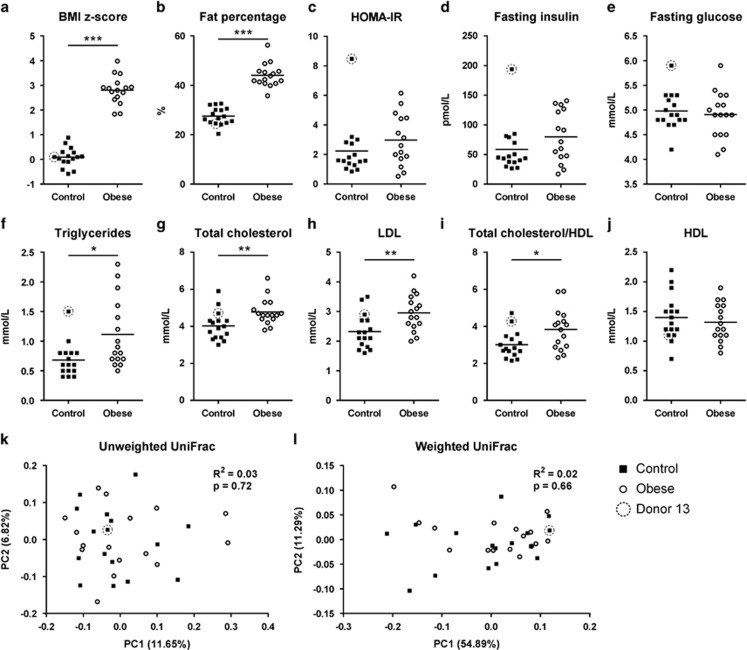
Figure 1.
Metabolic syndrome parameters and faecal microbiotas of obese human donors and controls. (a) Body mass index z-score, (b) fat percentage, (c) HOMA-IR, (d) fasting insulin in plasma, (e) fasting glucose in plasma. (f) Fasting triglycerides, (g) total cholesterol, (h) low-density lipoprotein (LDL) cholesterol, (i) ratio of total cholesterol to high-density lipoprotein (HDL) cholesterol and (j) HDL cholesterol in serum. PCoA based on unweighted (k) and weighted (i) UniFrac distances between faecal microbiotas of 16 obese human donors and 16 controls. In (a–j), the mean of each donor group is shown by a horizontal line, and asterisks represent significant differences between the two groups (*P<0.05, **P<0.01, ***P<0.001, unpaired t-test or Mann–Whitney test). In (k) and (l), P-values are listed for differential clustering assessed by ADONIS test and R2 values represent the percentage of variation explained by donor phenotype.

