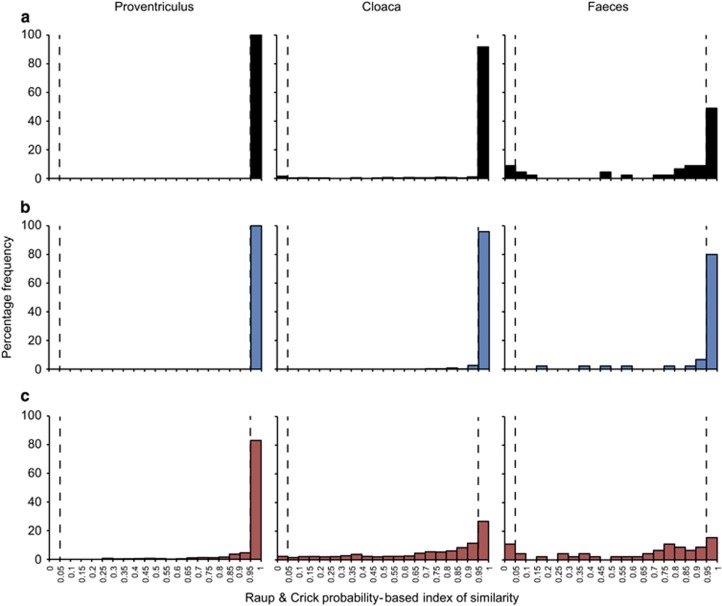
Figure 3.
Distribution of pair-wise Raup and Crick (SRC) probability-based index similarity frequencies for the (a) whole, (b) core and (c) satellite microbiota within each microbiome. SRC>0.95 indicate microbiota significantly less different than expected by chance. SRC<0.05, microbiota significantly more different from each other than by chance. SRC>0.05 and SRC<0.95 indicates stochastic assembly, with similarity no greater than expected than by chance, SRC<0.05 significant dissimilarity, SRC>0.95 significant similarity.

