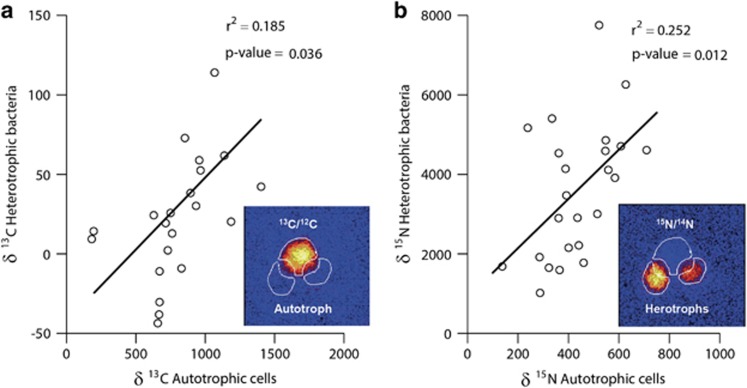
Figure 5.
(a) Positive correlation between the 13C incorporation rates of phytoplankton cells and those of their attached bacterial cells, analyzed with a smaller raster for one of the replicates of the warm incubations. (b) Similar positive correlation between the 15N incorporation rates of bacteria and those of the phytoplankton cells to which they were attached. Insets show an example of two heterotrophic bacteria attached to a picophytoplankton cell. Regions of interests (white outlines) for data extraction were drawn to ensure that overlapping areas were not used to measure isotope incorporation by the individual cells.

