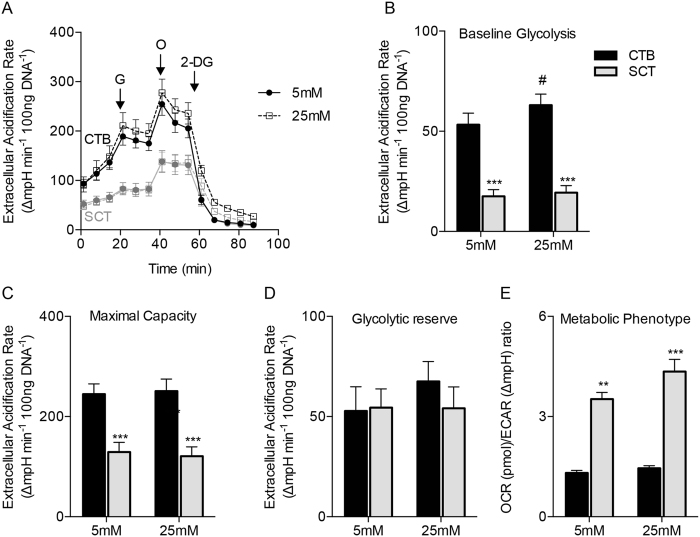
Figure 3. Cytotrophoblast are highly glycolytic.
The glycolytic metabolism of primary human trophoblast cells was measured in vitro using the Seahorse XF Analyzer. (A) CTB and SCT extracellular acidification rates (ECAR), a metric of glycolytic lactate production, was measured during a glycolytic stress experiment with Seahorse assay medium that was supplemented with pyruvate and glutamine only. At point G, 5 mM or 25 mM glucose was injected, 1 μM oligomycin at point O, and 100 mM 2-Deoxyglucose at point 2-DG. Oligomycin inhibits ATP production and 2-DG competitively reduces glucose utilization in the glycolytic pathway. (B) ECAR was greater in CTB than in SCT at baseline and was not affected by glucose concentration. (C) Maximal glycolytic capacity after oligomycin (O) injection which inhibits ATP production was highest in CTB, but the (D) glycolytic reserve was not different between cell types. These data suggest the presence of a substantially greater glycolytic flux in CTB than in SCT under these experimental conditions. (E) The ratio of OCR to ECAR at both concentrations of glucose indicates that CTB is more glycolytic than SCT under these conditions. Data are Mean ± SEM, n = 6 placentas. #p < 0.05 vs glucose concentrations.

