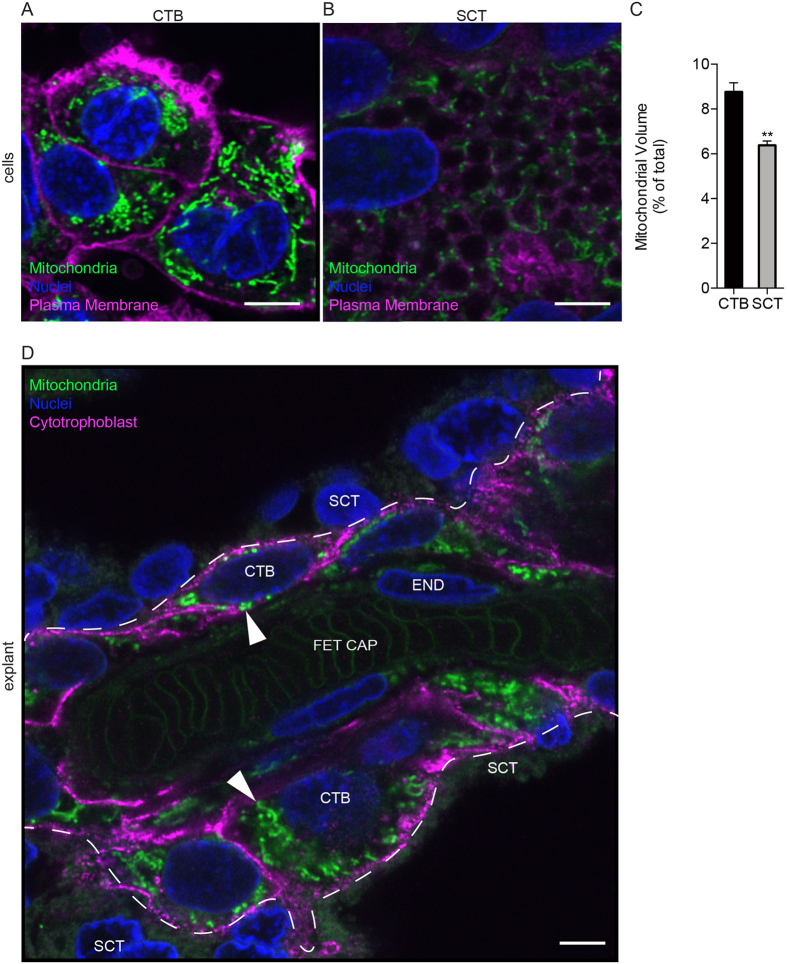
Figure 4. Differentiation of Cytotrophoblast to Syncytiotrophoblast leads to a fragmented mitochondrial network.
The mitochondrial activity indicator dye, Mitotracker (CM-H2TMRos) was used to localize active mitochondria in CTB and SCT in vitro and in living explants of human term placentas using super-resolution fluorescence microscopy. (A,B) Isolated CTB at 8 hr incubation. Wheat germ agglutinin (magenta) was used to label plasma membrane; nuclei are labeled with Hoechst dye (blue). (A) Mitochondria (green) in CTB are tightly packed in a perinuclear fashion. (B) The differentiation of CTB to SCT leads to a change in mitochondrial activity, morphology, and to a new arrangement adjacent to cytoplasmic vesicles. (C) Mitochondrial volume is relatively larger in CTB than in SCT in vitro. (D) Human placental explants. Dashed line represents the SCT-CTB interface. In fresh explants of human term placenta, the most active and most brightly stained mitochondria (arrowhead) are located in the CTB layer. A few active mitochondria are also visible in endothelium. CTB in the explants were specifically labeled using HAI-1 (magenta). SCT, Syncytiotrophoblast; CTB, cytotrophoblast; END, endothelium; FET CAP, Fetal Capillary. Scale Bar: 5 μm. Data are Mean ± SEM. Representative images from n = 3 placentas.

