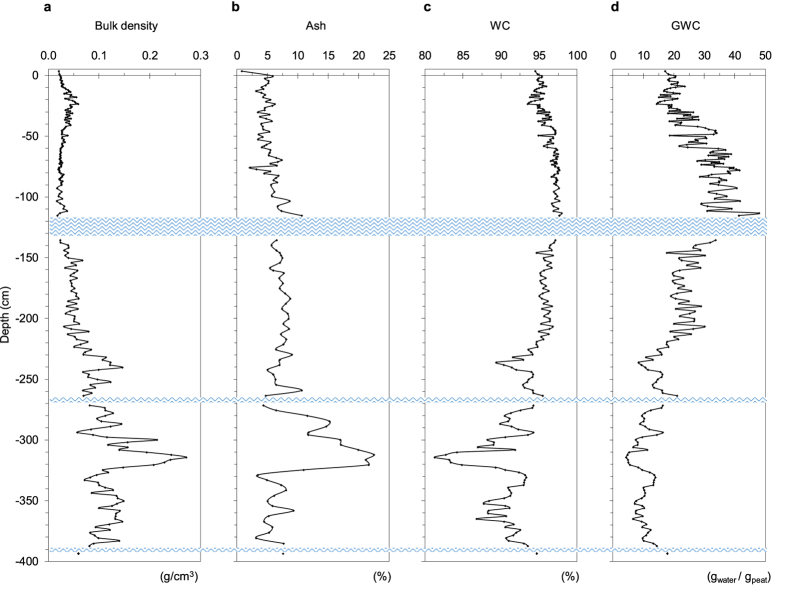
Figure 2. Variation of physical properties of peat with depth.
The figure illustrates the variation of bulk density (a), ash content (b), water content (WC) (c) and gravimetric water content (GWC) (d) trend throughout the 400-cm deep peat profile. Blue wavy lines represent water lenses occurring throughout the profile. More details are reported in Supplementary Information.

