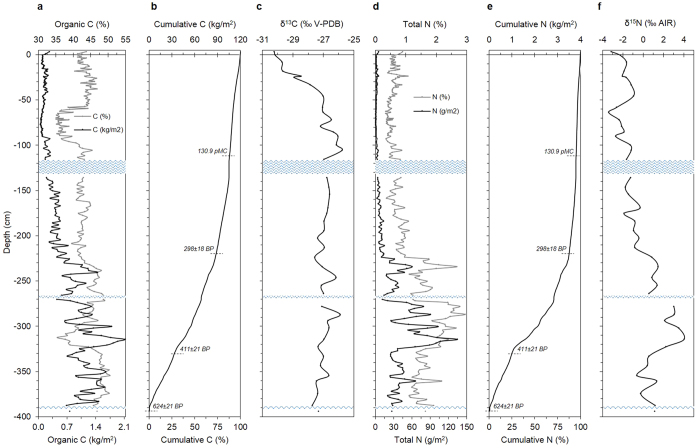
Figure 3. Carbon and nitrogen distribution with depth.
The figure illustrates the variation of total and cumulative concentration, as well as of its isotope signature, of both organic C (a–c) and total N (d–f) throughout the 400-cm deep peat profile. Blue wavy lines represent water lenses occurring throughout the profile. In panels (b) and (e), selected conventional 14C age dates are reported (for details, see Supplementary Table S4).

