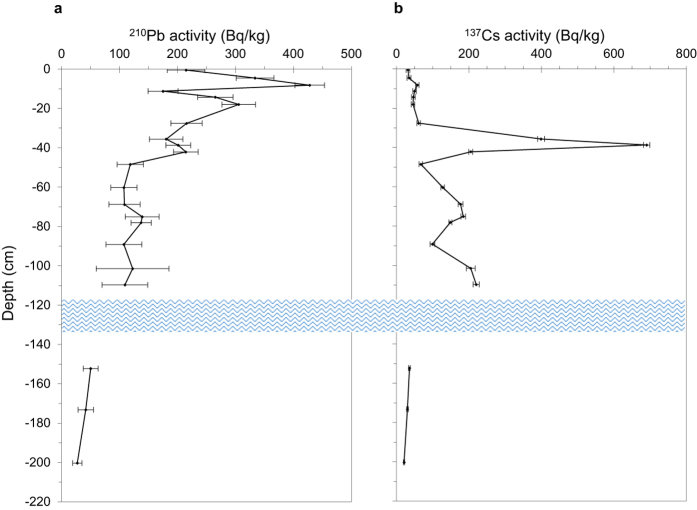
Figure 5. Concentrations of fallout radionuclides with depth.
The figure illustrates the concentration of total 210Pb (a) and radiocaesium (b) throughout the top, 200 cm deep, section of the peat profile. The blue wavy line represents the water lens occurring throughout the profile. Supported 210Pb (i.e., 226Ra) concentrations are extremely low (typically <2 Bq/kg), reflecting the highly OM content of the peat. Consequently, unsupported (fallout) 210Pb concentrations are scarcely distinguishable from total 210Pb concentrations. More details are reported in Supplementary Table S5.

