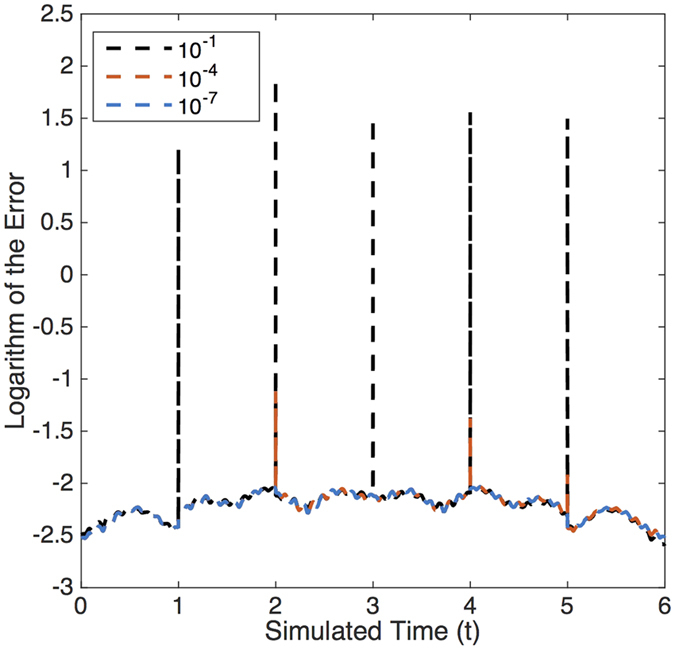
Figure 4. Error analysis.

We depict the decimal logarithm of the error as a function of time for three runs of the simulation with different distance with respect to the stationary state. The fact that the effective interaction between photons is null makes possible the analogy between the stationary state solution and the accumulation of solutions for an initial excitation combined until the initial population has escaped from the output port. Therefore, the distance is calculated as the norm of the population that remains in the chip. The dynamical constants of the system are equivalents to the ones in Fig. 2.
