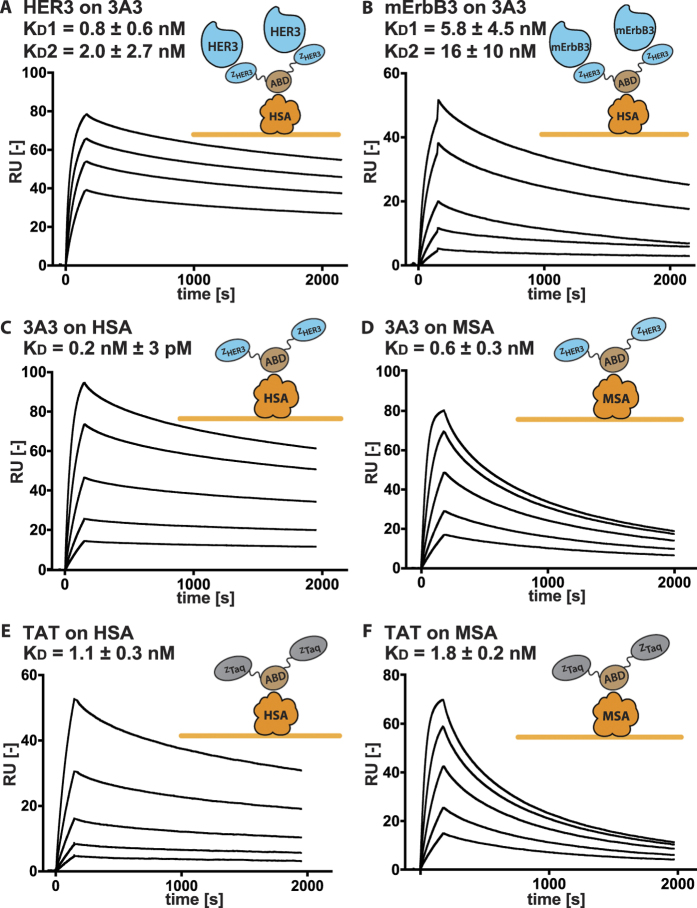
Figure 1. Results for the SPR affinity determinations.
All analytes were stepwise diluted 1:2 and injected in series over: (a) immobilized HSA and 3A3 captured with subsequent injections of 15.6 to 125 nM of HER3. Please note that the dissociation between 3A3 and HSA has been subtracted, (b) immobilized HSA and 3A3 captured with subsequent injections of 20 to 500 nM of mErbB3. Please note that the dissociation between 3A3 and HSA has been subtracted, (c) immobilized HSA with subsequent injections of 1.6 to 25 nM of 3A3, (d) immobilized MSA with subsequent injections of 1.6 to 25 nM of 3A3, (e) immobilized HSA with subsequent injections of 1.6 to 25 nM of TAT, (f) immobilized MSA with subsequent injections of 3 to 50 nM of TAT.

