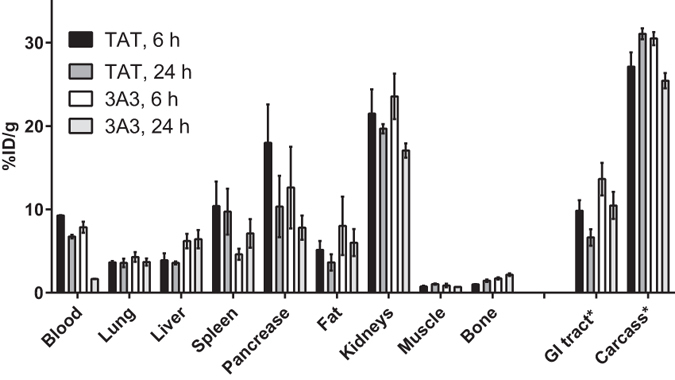
Figure 5. Comparison of biodistribution profiles of 111In-DOTA-3A3 and 111In-DOTA-TAT at 6 and 24 h after ip injections in NMRI mice.

Results are presented as average of percent injected dose per gram tissue (%ID/g) for 4 animals ± SD. *Uptake in GI (gastrointestinal tract) and carcass is presented as %ID in whole sample.
