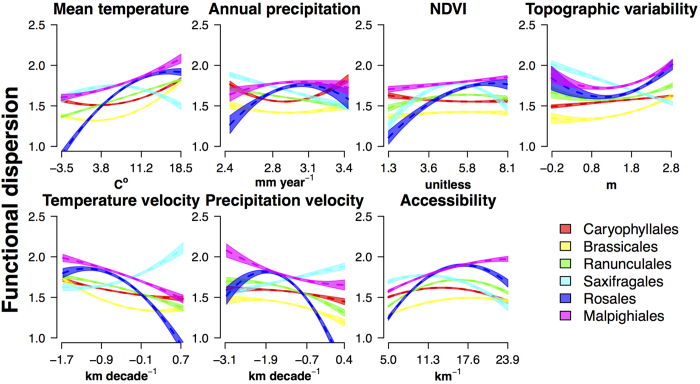
Figure 5. Changes in functional dispersion of six European plant orders as a function of contemporary and historical environmental conditions.
Plots show the effects of mean annual temperature, total annual precipitation NDVI, topographic heterogeneity, temperature velocity, precipitation velocity and accessibility on functional dispersion. Assessed orders are illustrated with different colours. Shaded areas over the dashed regression lines represent the 95% confidence interval of predicted values for each evaluated order.

