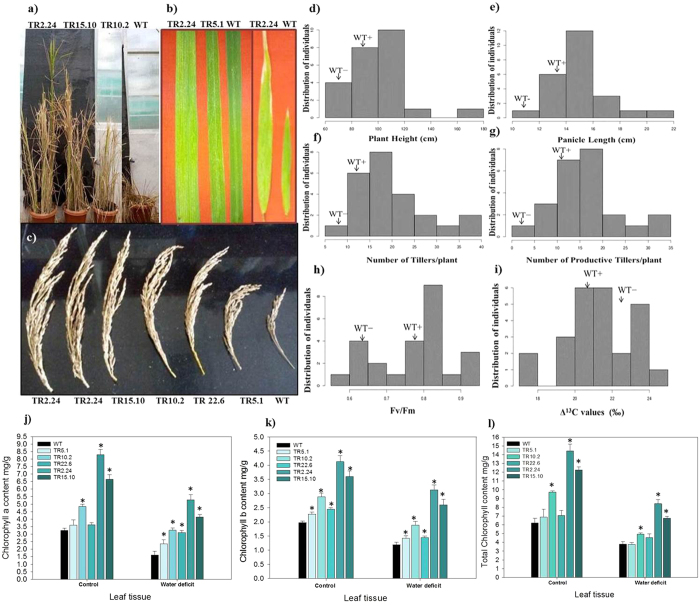
Figure 4. Phenotypic characterization, Quantum efficiency, ∆13C analysis and Chlorophyll estimation in 35 S: AtTOR transgenic rice plants in T2 generation.
(a) Phenotypic observations of high expression lines, TR2.24, TR.15.10; medium expression line, TR10.20 with respect to WT grown under limited water conditions. (b) Variation in size of boot leaf and (c) Panicle length. Graphical representation of (d) plant height, (e) panicle length, (f) number of tillers and the (g) number of productive tillers observed under limited water conditions. (h) Quantum efficiency of PSII in transgenic plants was measured under water-limited conditions. High expression transgenic lines, TR2.24 and TR15.10, had the highest quantum yield of >0.90 (i) Transgenic plants TR2.24, and TR 15.10 had low Δ13C values of 17.02‰ and 17.4‰, respectively under limited water conditions indicating their high WUE while WT grown under similar circumstances had a Δ13C value of 21.95‰. ∆13C was analyzed using IRMS. (j) Chlorophyll-a, (k) Chlorophyll-b content, and l) total chlorophyll content in low (TR5.1), medium (TR10.2, TR22.6) and high (TR2.24, TR15.10) expression lines were measured before and after growth of plants under limited water conditions. Mean values of chlorophyll data with ± SE represented with asterisks were considered statistically significant at P < 0.05.

