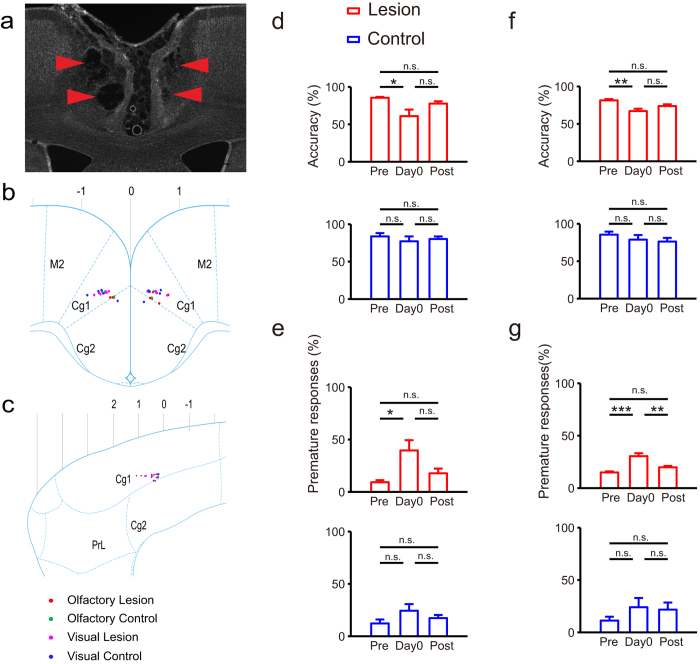
Figure 2. Effect of ACC lesions on sustained attention in visual and olfactory modalities.
(a) An example of ACC with lesion by injection of Ibotenic acid (IBO). (b,c) IBO or control saline injection sites. Sites depicted here were deduced from coordinates relative to bregma (coordinate: 0, 0, 0) recorded in the surgery procedure and confirmed by histological methods (see panel a). Rat brain sketches were from Paxinos and Watson, 2007. (b) Injection sites targeting sagittal sections of rat brain (lateral 0.18 mm). (c) Injection sites targeting coronal sections of rat brain (bregma 0.48 mm). (d–g) Comparisons in accuracy or proportion of premature responses among different time. Top: comparisons in lesion group. Bottom: comparisons in control group. Pre: averaged behavioral performance on five test days before surgery; Day 0: behavioral performance on first post-surgery day; Post: averaged behavioral performance on five test days after first post-surgery day. (d,e) Visual attention (Total: n = 11, lesion: n = 6, control: n = 5). (d) Lesion effects in accuracy (one-way ANOVA: Lesion: F(2,15) = 5.41, P = 0.017, Control: F(2,12) = 0.44, P = 0.657). (e) Lesion effects in premature responses (one-way ANOVA: Lesion: F(2,15) = 6.16, P = 0.011, Control: F(2,12) = 1.78, P = 0.210). (f,g) Olfactory attention (Total: n = 9, lesion: n = 5, control: n = 4). (f) Lesion effects in accuracy (one-way ANOVA: Lesion: F(2,12) = 8.56, P = 0.005, Control: F(2,9) = 0.87, P = 0.452). (g) Lesion effects in premature responses (one-way ANOVA: Lesion: F(2,12) = 17.82, P = 0.0003, Control: F(2,9) = 1.00, P = 0.407). The results of multiple comparisons showed in panel d-g were from post hoc of one-way ANOVA with Bonferroni adjustment.

