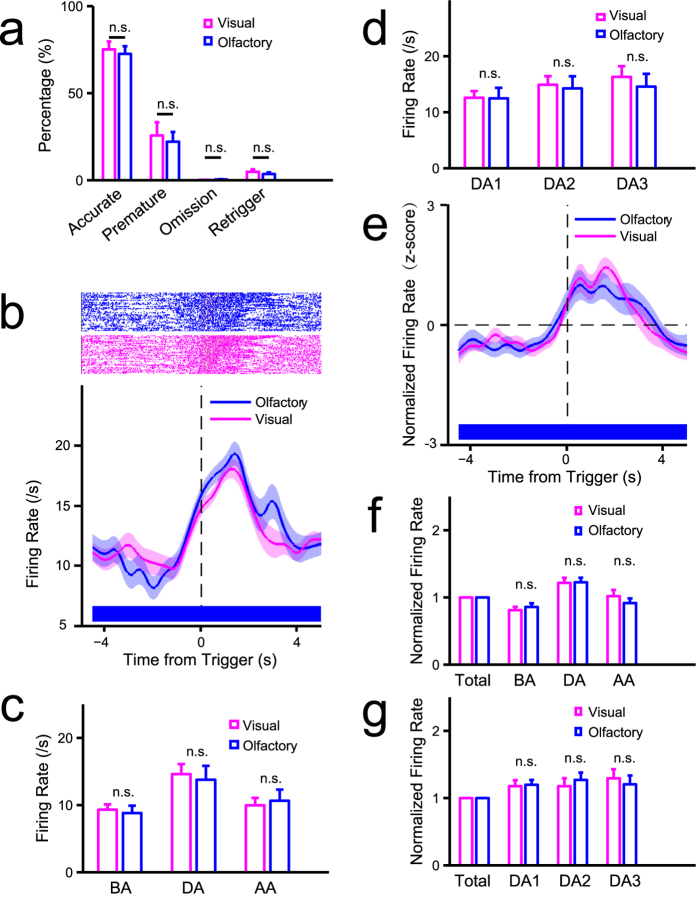
Figure 4. The neuronal basis of sustained attention in ACC is comparable in different sensory modalities.
(a) Comparisons in behavioral performance between visual and olfactory attention (n = 11, 5 rats first trained in olfactory task, 6 first in visual task). (b–g) Electrophysiological data (rat no. = 2). (b) Comparisons in activity of an attention-related activated neuron (#5) between different modalities. Top: raster plots of spikes, grey transparent shadow indicates TSI time window; bottom: trend of firing rate in correct trials aligned to the time of trigger onset. (c) Comparisons in firing rate of neuron #5 in the time windows of DA, BA, and AA (see Fig. 3) between visual and olfactory attention (two-way mixed ANOVA with Greenhouse-Geisser adjustment: time: F(2,188) = 37.26, P = 8.46e-12; time × modality: F(2,188) = 0.81, P = 0.420). (d) Comparisons in firing rate of neuron #5 in the time windows of DA1, DA2, and DA3 (see Fig. 3) between visual and olfactory attention (two-way mixed ANOVA with Greenhouse-Geisser adjustment: time: F(2,188) = 12.20, P = 1.84e-5; time × modality: F(2,188) = 0.95, P = 0.384). (e) Trend of normalized population activities of attention-related activated neurons in correct trials aligned to the time of trigger onset in visual and olfactory attention (n = 9, proportion = 9.68%). (f) Comparisons in normalized firing rate (see Fig. 3e) of all attention-related activated neurons (same as e) in the time windows of DA, BA, and AA between visual and olfactory attention (two-way ANOVA with Greenhouse-Geisser adjustment: modality: F(1,8) = 0.14, P = 0.719; time: F(2,16) = 12.59, P = 6.21e-4; modality × time: F(2,16) = 1.41, P = 0.273). (g) Comparisons in normalized firing rate (see Fig. 3e) of all attention-related activated neurons (same as e) in the time windows of DA1, DA2, and DA3 between visual and olfactory attention (two-way ANOVA with Greenhouse-Geisser adjustment: modality: F(1,8) = 0.01, P = 0.925; time: F(2,16) = 0.10, P = 0.808; modality × time: F(2,16) = 1.62, P = 0.230). The statistic results showed in panel c,d,f, and g were from post hoc simple effect analyses (MANOVA).

