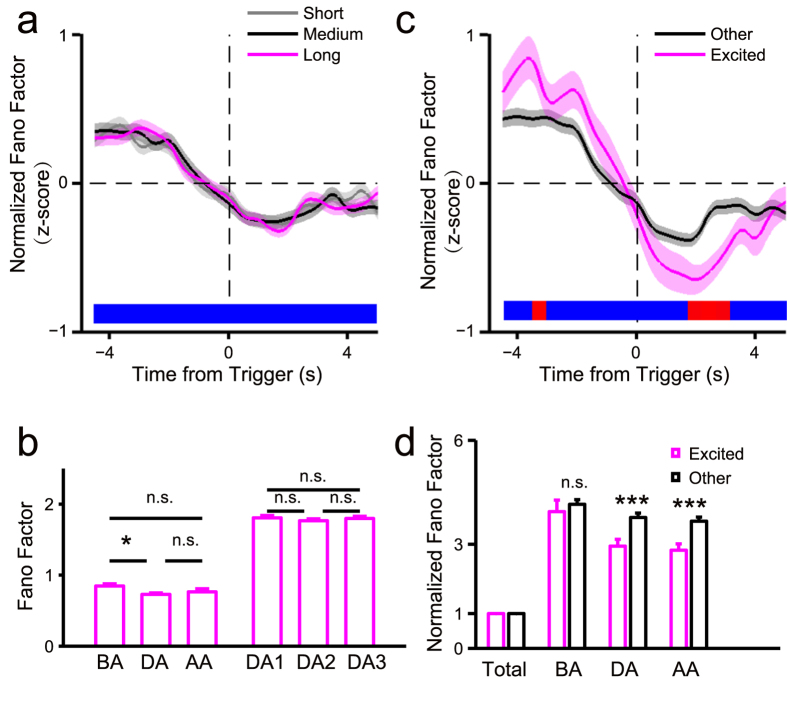
Figure 5. Fano factor of the recorded neurons in visual task was correlated with sustained attention.
The data were the same as data in Fig. 3: rat no. = 4, all recorded neuron no. = 351, excited neuron no. = 46. (a) Trend of normalized fano factor of all recorded neurons in correct trials at the three TSI values aligned to the time from trigger. (b) Comparisons in fano factor among different time windows (see Fig. 3 for definitions of time windows) (one-way ANOVA: BA, DA, and AA: F(2,1044) = 3.51, P = 0.030; DA1, DA2, and DA3: F(2,1044) = 0.47, P = 0.627). The statistic results showed in this panel were from post hoc multiple comparisons of one-way ANOVA with Bonferroni adjustment. (c) Trend of normalized fano factor for excited and other neurons in correct trials aligned to the time from trigger. (d) Comparisons in normalized fano factor (normalized to fano factor of the total time window) in time windows of BA, DA, or AA between excited and other neurons (two-way mixed ANOVA with Greenhouse-Geisser adjustment: time: F(2,698) = 26.35, P = 1.90e-11; time × neuron type: F(2,698) = 6.35, P = 0.002). The statistic results showed in this panel were from post hoc simple effect analyses (MANOVA).

