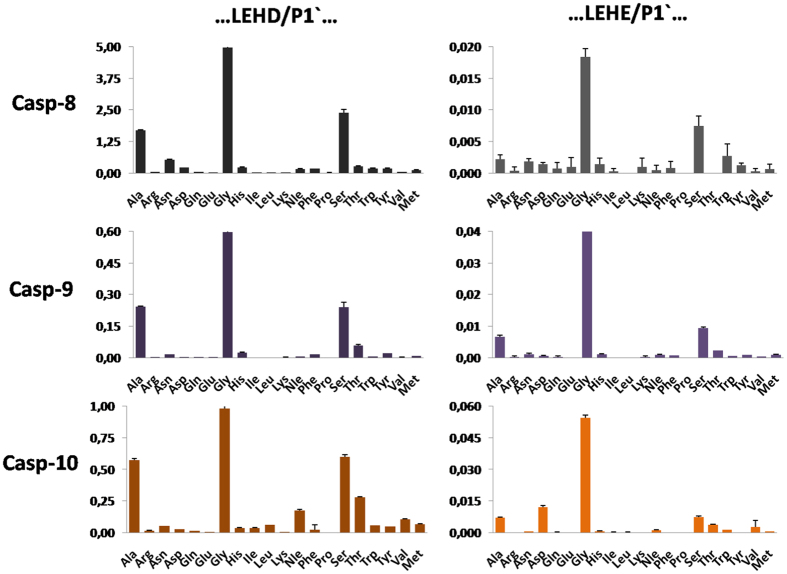
Figure 9. P1′ substrate specificity profiles of caspase-8, caspase-9, and caspase-10, as determined using two internally quenched fluorogenic substrates libraries containing either Asp or Glu at P1 (ACC-GLEH(D/E)-XKK(DNP)G-NH2).
The library concentration was 2 μM. The x-axis represents amino acids using the standard three-letter code, and the y-axis shows the substrate hydrolysis rate expressed as RFU/s/10 nM caspase (relative fluorescence units per second per 10 nM of caspase).

