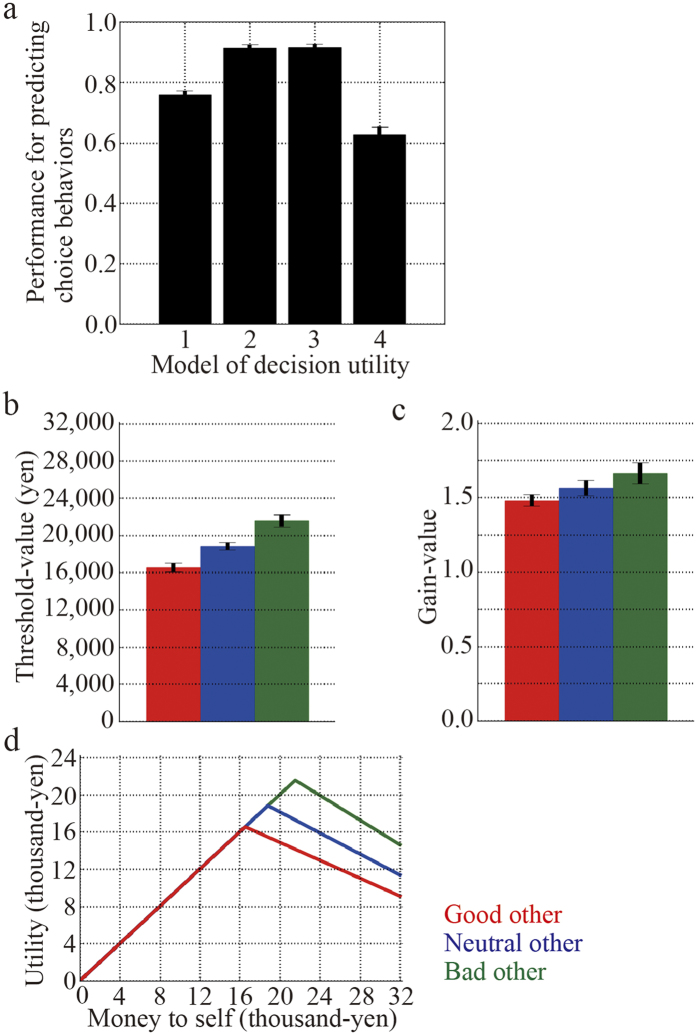
Figure 3. Decision utility properties.
(a) Performances of four decision utilities for predicting behaviour choice. The numbers one, two, three, and four in the horizontal axis indicate models one, two, three, and four, respectively. These models are defined in the Methods section. (b) Group averages of the threshold value θ of the model 2 decision utility as defined by eq. (2). (c) Group averages of the gain value α of the model 2 decision utility. (d) Shape of the model 2 decision utility. The graph was plotted using the group averages of the threshold and gain values for each moral trait condition. Red, blue, and green indicate good, neutral, and bad others, respectively.

