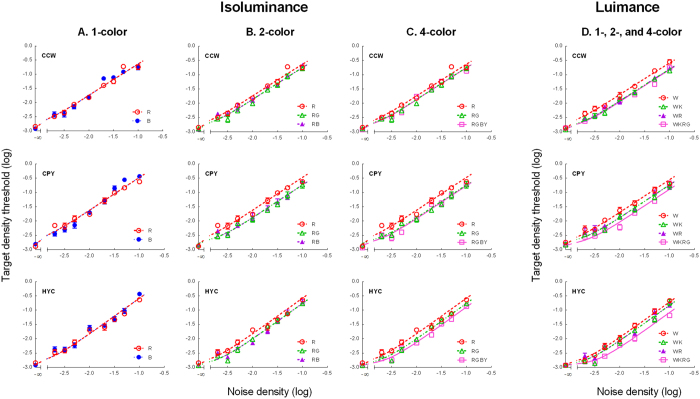
Figure 2. Target threshold vs. mask density (TvD) functions.
(A–C) The TvD functions for the isoluminance conditions. Each panel represents the data from one observer. (A) 1-color conditions. The red and blue symbols represent the data points of the R and B conditions respectively. (B) 2-color conditions. The green and purple symbols represent the data points of the RG and RB conditions respectively. (C) 4-color condition. The pink symbols represent the data points of the RGBY condition. The smooth curves are fits of the model. The curves of condition R in the middle and right columns are the same as in the left one, and the curve of RG in the right column is the same as in the middle one, re-plotted for comparison. (D) The TvD functions for the luminance conditions. Each panel represents the data from one observer. The red, green, purple, and pink symbols represent the data points of the W, WK, WR, and WKRG conditions respectively. The smooth curves are fits of the model.

