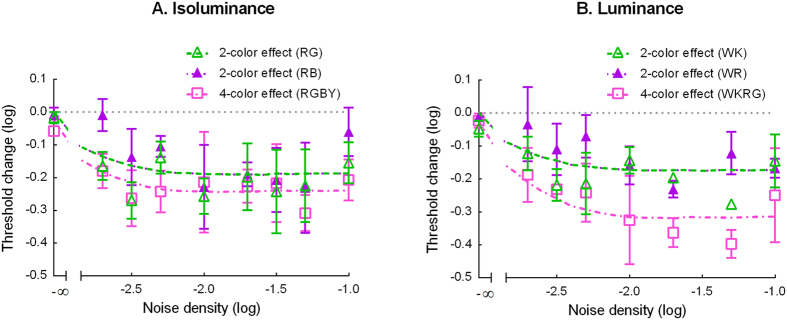
Figure 3. The average threshold change produced by 2-color and 4-color conditions.
(A) Isoluminance condition. The average threshold change produced by the two 2-color (RG and RB, green and purple symbols) and the one 4-color (RGBY, pink symbols) isoluminance conditions at different noise densities. (B) Luminance condition. The average threshold change produced by the two 2-color (WK and WR, green and purple symbols) and the one 4-color (WKRG, pink symbols) luminance conditions at different noise densities. The error bar is the standard error. The smooth curves are the predictions of the model.

