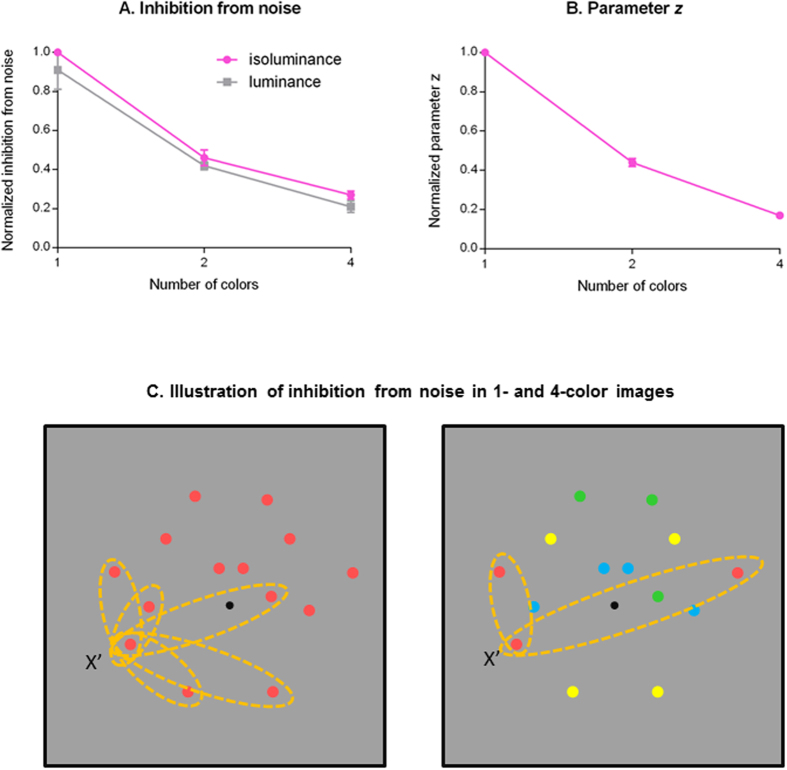
Figure 5. Model parameters illustration.
(A) The amount of the normalized inhibition from noise in different conditions. The pink symbols represent the normalized inhibition for the isoluminance conditions averaged across three observers, and the gray symbols represent that for luminance conditions. (B) The amount of the normalized constant z in different conditions. The pink symbols represent the normalized z value for the 1-, 2-, and 4-color conditions, averaged across two types of color modulations and three observers. (C) The illustration of inhibition from noise in 1- and 4-color images. The number of the possible candidates each noise dot can pair with decreases when the number of the colors increases. The yellow dashed ovals represent the possible pairs a red noise dot x’ can form in the image. The red noise dot x’ can pair with all the dots in the 1-color image while it can only pair with two dots in the 4-color image.

