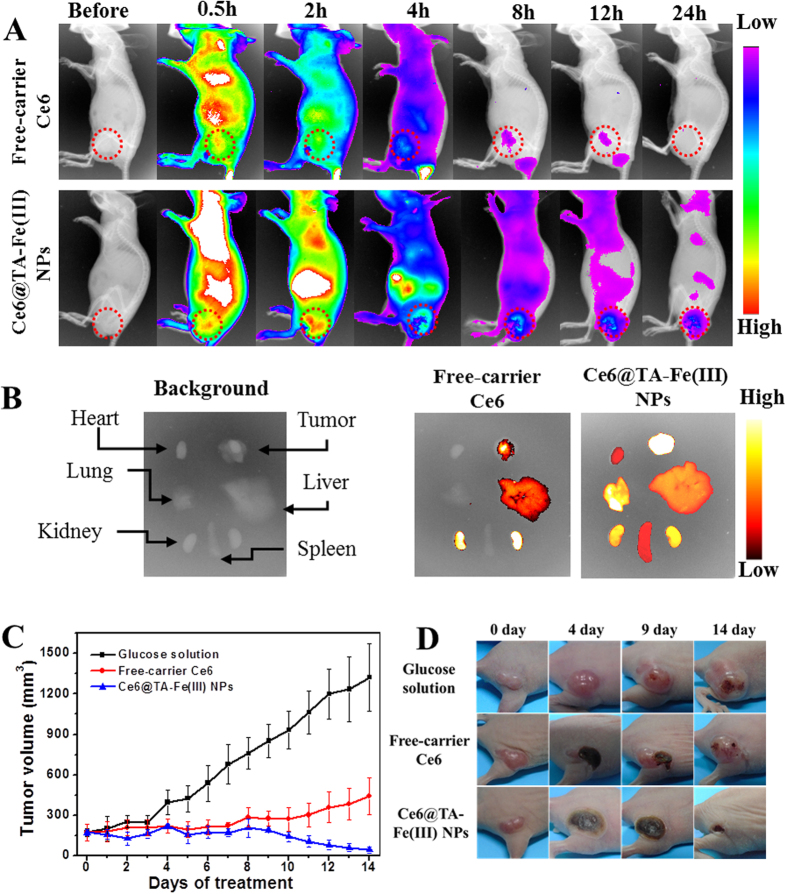
Figure 4.
(A) Time-dependent whole body fluorescence images of MCF-7 tumor-bearing mice treated with free-carrier Ce6 or Ce6@TA-Fe(III) NPs. Red circles indicate tumor sites. (B) Ex-vivo fluorescence images of resected organs and tumor from the mice injected with free-carrier Ce6 or Ce6@TA-Fe(III) NPs (24 h post-injection). (C) Tumor growth curves of different groups after various treatments. (D) Photographs of mice showing the change of tumor after various treatments at different time points.

