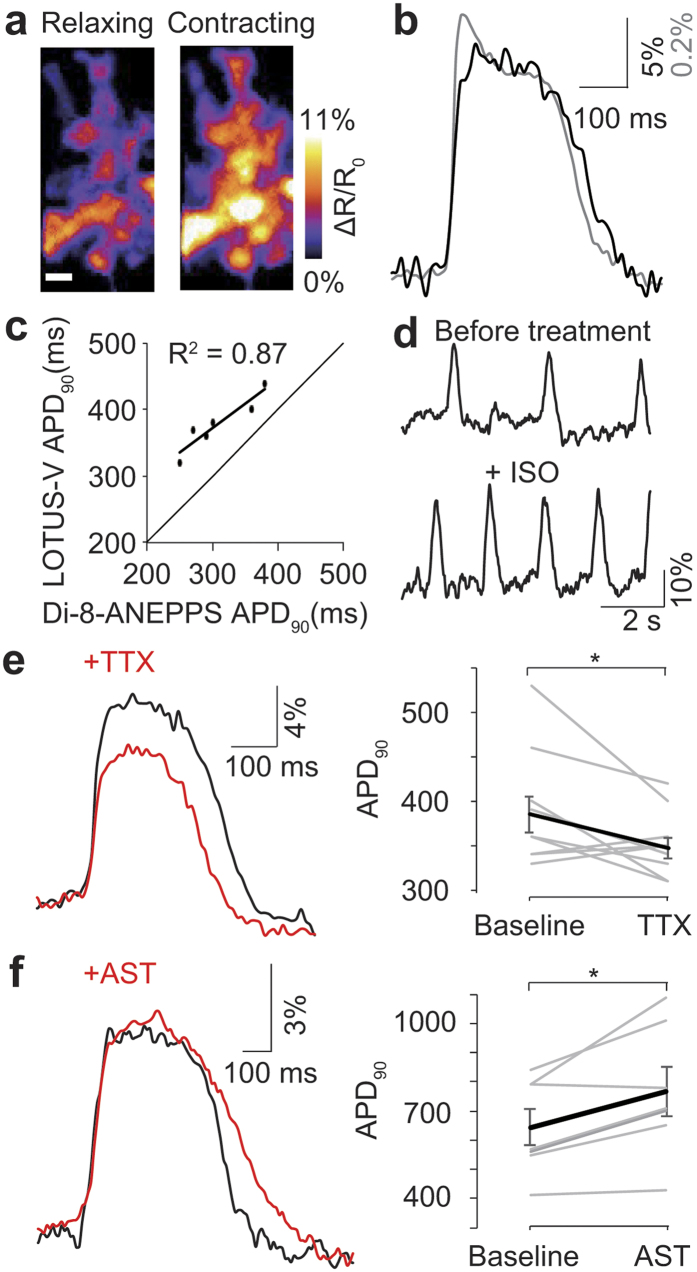
Figure 4. Voltage imaging in hiPSC-CMs.
(a) Ratio images of hiPSC-CMs expressing LOTUS-V before and during contraction (n = 23). Scale bar, 50 μm. (b) Bioluminescence recording (black) overlaid on a fluorescence recording using Di-8-ANEPPS (gray) during hiPSC-CM contraction (n = 38). The power density of excitation light for Di-8-ANEPPS was 735 mW/cm2. (c) APD90 measured by LOTUS-V plotted against APD90 measured by Di-8-ANEPPS. The line fitted by least squares method is shown in black. (d) Time course of the ΔR/R0 emission ratio before and after treatment with 100 nM isoproterenol. (e,f) Evaluation of action potential morphology before and after treatment with 30 μM TTX (n = 17) (e), and 10 μM astemizole (n = 12 and 8, respectively) (f). The graphs indicate individual APD90 changes upon drug treatment. Wilcoxon signed-rank test was performed. *p < 0.05; Error bars indicate mean ± s.e.m.

