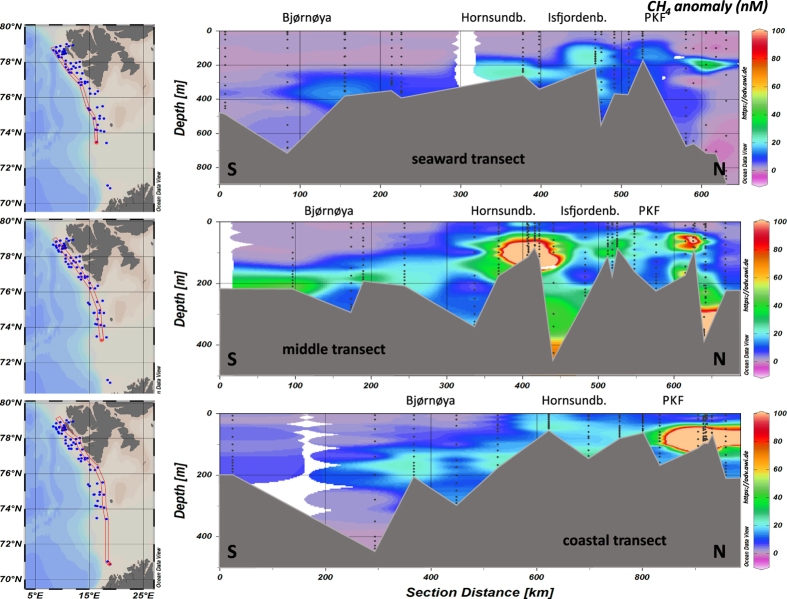
Figure 3. South to north transects of dissolved methane concentration anomalies.
Methane anomalies were derived by subtracting the atmospheric methane equilibrium concentrations from the measured methane concentrations. The maps indicate the transect location and the red star marks the starting point. Above each contour plot, the approximate location along the transect is indicated. The abbreviations stand for Hornsundb. – Hornsundbanken, Isfjordenb. – Isfjordenbanken, and PKF – Prins Karls Forland. The plot was generated using Ocean Data View Version 4.5.7 (https://odv.awi.de) gridding weighted averages.

