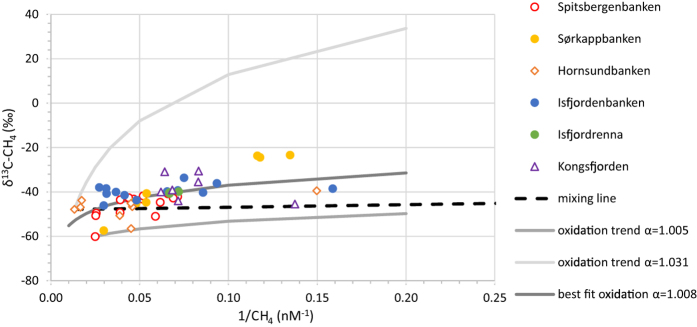
Figure 4. δ13C vs. 1/CH4 concentration for water samples.
Samples are grouped according to their location at the Svalbard shelf. The stippled black line marks a mixing line between the sample with the highest methane concentration and background methane values of the ocean. The gray lines indicate microbial oxidation trends. The best fit to all data has an R2 of 0.36 with a δ13C-value of the source methane of −64‰.

