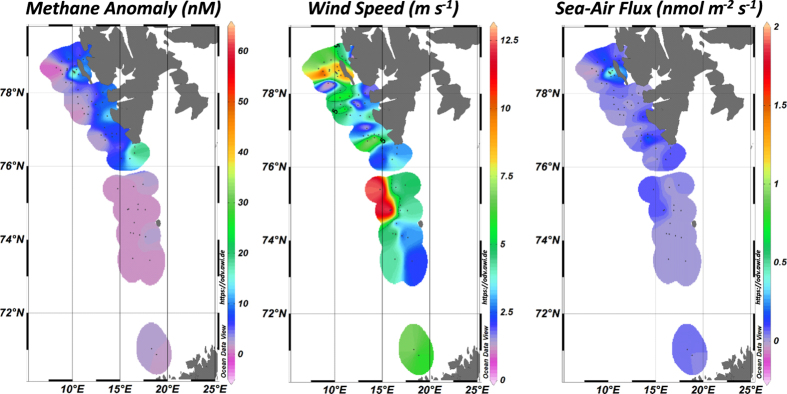
Figure 6. Surface methane anomalies, wind speed at 10 m above sea-surface during the time when water samples were collected, and sea-air flux of methane.
The resulting sea-air flux of methane was elevated at the seepage sites off PKF, Hornsundbanken, and Sørkappbanken as well as in areas of wind speeds >5 m s−1. The plot was generated using Ocean Data View Version 4.5.7 (https://odv.awi.de) gridding weighted averages.

