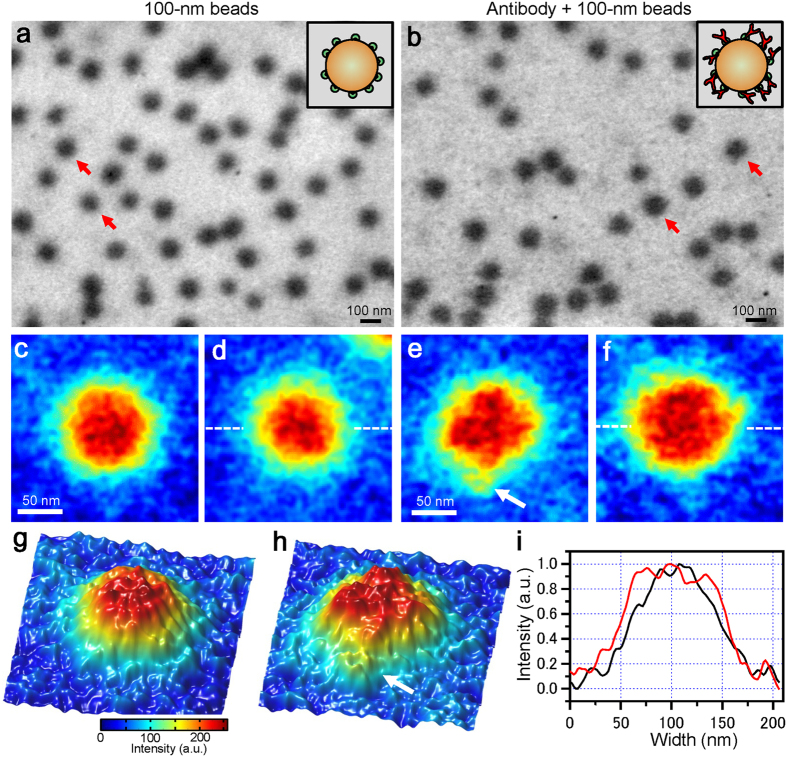
Figure 2. Imaging of polymeric beads in liquid using the SE-ADM system.
(a) A dielectric image of the 100-nm polystyrene beads conjugated with streptavidin in liquid at 50,000× magnification under a 3.6-kV electron beam acceleration. The image was filtered using 2D GF (11 × 11 pixels, 1.2σ) after background subtraction. Several clear black spheres dispersed over the whole area represent the 100-nm polystyrene beads. A schematic figure in the upper-right square shows polystyrene beads conjugated with streptavidin on their surface. (b) A dielectric image of 100-nm polystyrene beads conjugated with streptavidin bound to biotin-conjugated anti-CD44 antibodies in liquid at 50,000× magnification. The image of antibody-binding beads shows a rough surface with a small projection form. A schematic figure in the upper-right square shows polystyrene beads conjugated with streptavidin and antibodies on their surface. (c,d) Expanded pseudo-colour images of 100-nm beads indicated by the red arrows in (a). These beads surfaces are smooth. (e,f) Expanded pseudo-colour images of 100-nm beads to which anti-CD44 antibodies are bound (indicated by the red arrows in (b)). These beads have very rough surfaces. (g) A 3D colour map of the same beads in (c). (h) A 3D colour map of the same beads to which antibodies are bound in (e). The white arrow suggests the anti-CD44 antibody. (i) Comparison of the line plots of bead centres. The black line shows the 100-nm beads of (d), while the red line shows the beads to which antibodies are bound in (f). The range of the red line is wider than that of the black line. Scale bars are 100 nm in (a) and (b), and 50 nm in (c) and (e).

