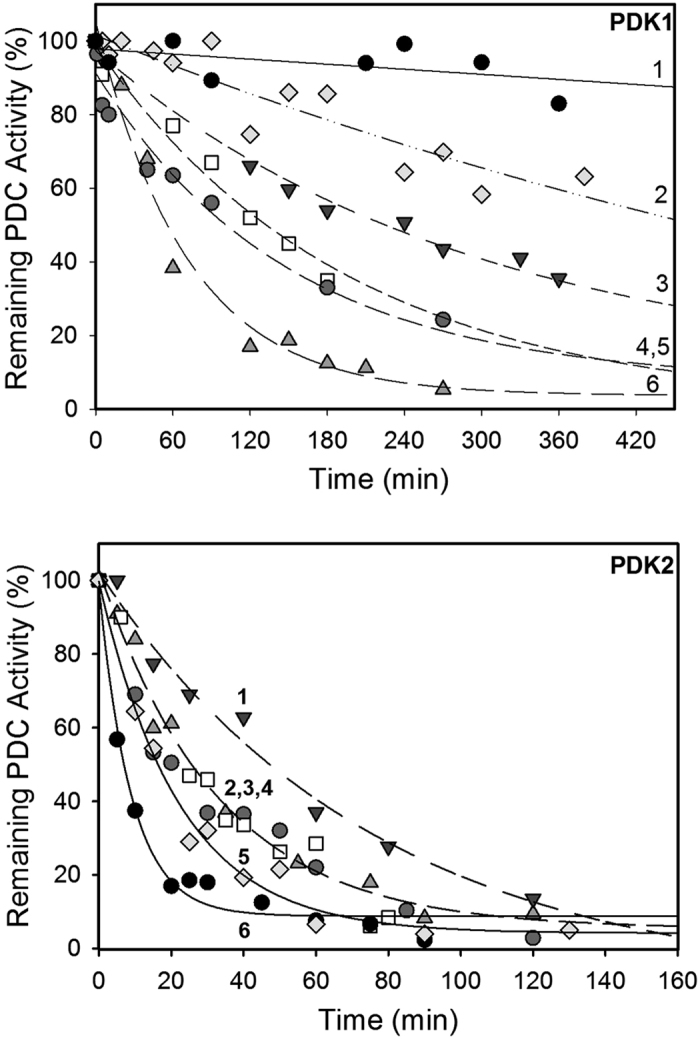
Figure 2. Time-dependence of PDC inactivation by PDK1 and PDK2.

(Top) PDK1 (3.0 μg, 0.1 μM) in 50 mM KH2PO4 (pH 7.5) supplemented with 0.5 mM ThDP, 1.0 mM MgCl2, 4.0 mM DTT and 0.1 mM EDTA was incubated with E1 (75 μg, 1.95 μM) in the presence of either L1L2S (3.0 μg, 0.3 μM) (line 6,  ); E2⋅E3BP (3.0 μg, 0.2 μM), (line 5,
  ); L2S (2.4 μg, 0.5 μM), (line 4, ◽); L1 (3.0 μg, 1.0 μM) (line 3,
  ); L3S’ (1.0 μg, 0.5 μM) (line 2,
  ) or with no lipoyl domain source (line 1, ●). Phosphorylation was initiated by ATP (0.5 mM) at 23 °C. (Bottom) PDK2 (6.6 μg, 0.48 μM) in 50 mM KH2PO4 (pH 7.5) supplemented with 0.5 mM ThDP, 1.0 mM MgCl2, 4.0 mM DTT, and 0.1 mM EDTA was incubated with E1 (80 μg, 3.5 μM) with no lipoyl domain source (line 6, ●); in the presence of either: L3S’ (1.0 μg, 0.24 μM) (line 5,
  ); E2· E3BP (2.0 μg, 0.22 μM) (line 4,
  ); L1L2S (1.2 μg, 0.22 μM), (line 3,
  ); L2S (0.8 μg, 0.22 μM) (line 2, ◽) and L1 (0.4 μg, 0.22 μM), (line 1,
  ). Phosphorylation was initiated by ATP (2.0 mM) at 30 °C. Aliquots (1 μg E1) were withdrawn at different times and were mixed with E2⋅E3BP and E3 at a mass ratio of E1:E2·E3BP: E3 of 1:3:3 to measure PDC activity.
