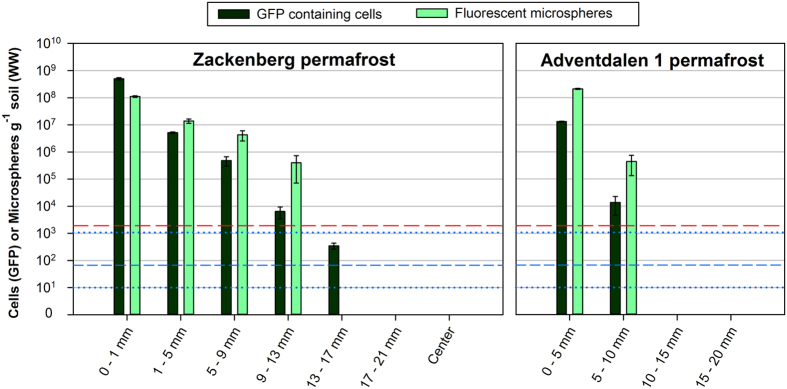
Figure 3. Number of tracer elements at different distances from the surface of the “Zackenberg” and “Adventdalen 1” permafrost cores.
Red dashed line (long dash) and blue dashed line (short dash) indicate calculated detection limit for the fluorescent microspheres and the GFP containing cells, respectively. Blue dotted lines indicate the interval of the experimentally determined detection limit of the P. putida, GFP, tracer. Bars represent means ± standard error of the mean from nine replicates for each GFP measurement and 30 replicates for quantification of microspheres.

