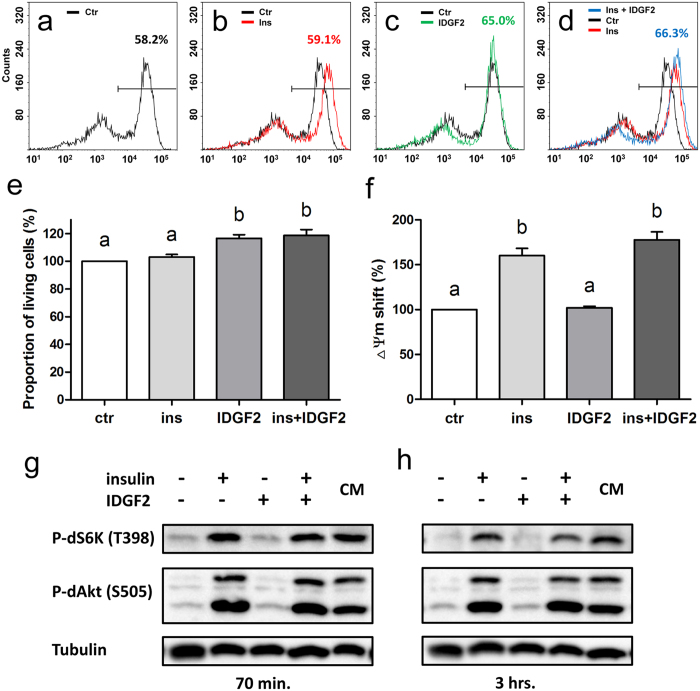
Figure 4. Effects of insulin and IDGF2 on Cl.8+ cells in chemically defined media.
(a–d) Representative examples of flow cytometry plots of TMRE fluorescence of Cl.8+ cells incubated for 24 h in (a) MM (b) MM with insulin, (c) MM with IDGF2 and (d) MM with insulin and IDGF2. Numbers represent the proportion of viable cells. (e) The effects of insulin and IDGF2 on the proportion of living cells. Values represent the average percentage change in TMRE staining of living cells (right peaks) compared to control. The graph summarizes the three cell cytometry experiments shown in Fig. S3. (f) Effects of insulin and IDGF2 on the position of the right peak median. Values represent the average median increase in TMRE staining of living cells (right peaks) compared to control. The graph summarizes the three flow cytometry experiments shown in Fig. S3. Data in the graphs are presented as mean ± SEM. Significant differences were evaluated by ANOVA followed by Tukey test and are indicated by different letters (p < 0.05). (g,h) Western blot analysis comparing the levels of phosphorylated dS6K (T398) and dAkt/PKB (S505) in Cl.8+ cells grown in MM for 24 hours, followed by insulin (0.125 IU/ml) or IDGF2 (16 μg/ml) treatment. CM – cells grown in complete media. The cells were harvested after 70 min (g) and 3 hrs (h) incubation. The phosphorylation of dS6K and dAkt/PKB was significantly increased in insulin-treated cells, but not in IDGF2-treated cells. Tubulin detected with anti-alpha tubulin antibody was used as a loading control. Full-length blots are shown in Fig. S11.

