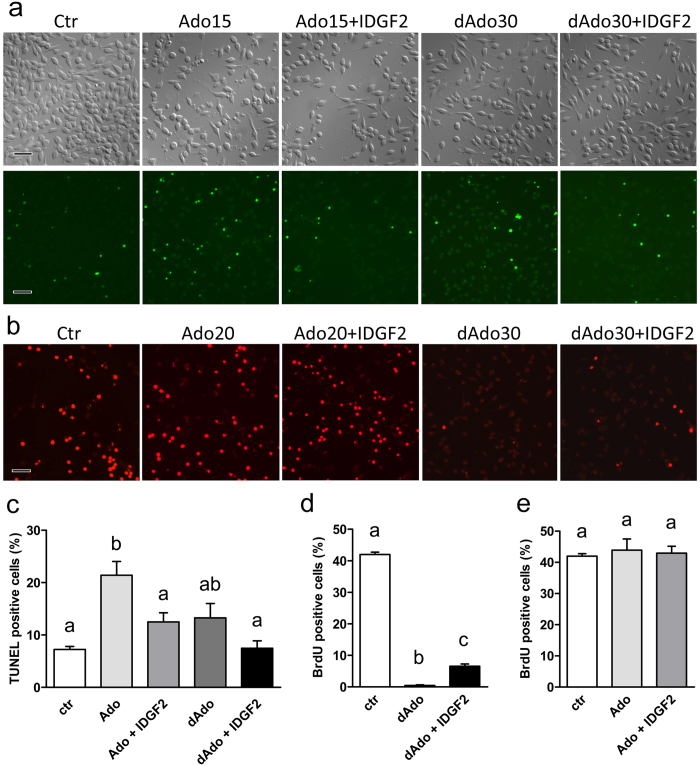
Figure 5. Cytoprotective effects of IDGF2 on Cl.8+ cells in MM treated with Ado and dAdo.
(a) Effect of Ado (15 μM), IDGF2 (16 μg/μl) plus Ado (15 μM), dAdo (30 μM), and IDGF2 (16 μg/μl) plus dAdo (30 μM) on Cl.8+ cell morphology in the top panels and DNA fragmentation (TUNEL staining) in the bottom panels. Green spots represent the nuclei of apoptotic cells. The addition of IDGF2 reduced the number of apoptotic cells in Ado-treated Cl.8+ cells. Bar = 100 μm. (b) BrdU staining (red). The cells were treated with dAdo (30 μM), IDGF2 (16 μg/μl) plus dAdo (30 μM), Ado (20 μM), IDGF2 (16 μg/μl) plus Ado (20 μM). dAdo-treated cells were essentially negative for BrdU incorporation. The addition of IDGF2 to dAdo increased the number of BrdU-positive cells. dAdo treated Cl.8+ cells did not show morphological changes connected with apoptosis, but they did not proliferate. (c) Effects of Ado, dAdo and IDGF2 on the relative proportion of the TUNEL-positive (apoptotic cells) Cl.8+ cells. Concentrations: Ado (15 μM), IDGF2 (16 μg/μl), dAdo (30 μM). (d,e) Effects of Ado, dAdo and IDGF2 on the relative proportion of the BrdU-positive Cl.8+ cells. Concentrations: Ado (20 μM), IDGF2 (16 μg/μl), dAdo (30 μM). Data in the graphs are presented as mean ± SEM (n = 3). Significant differences were evaluated by ANOVA followed by Tukey test and are indicated by different letters (p < 0.05).

