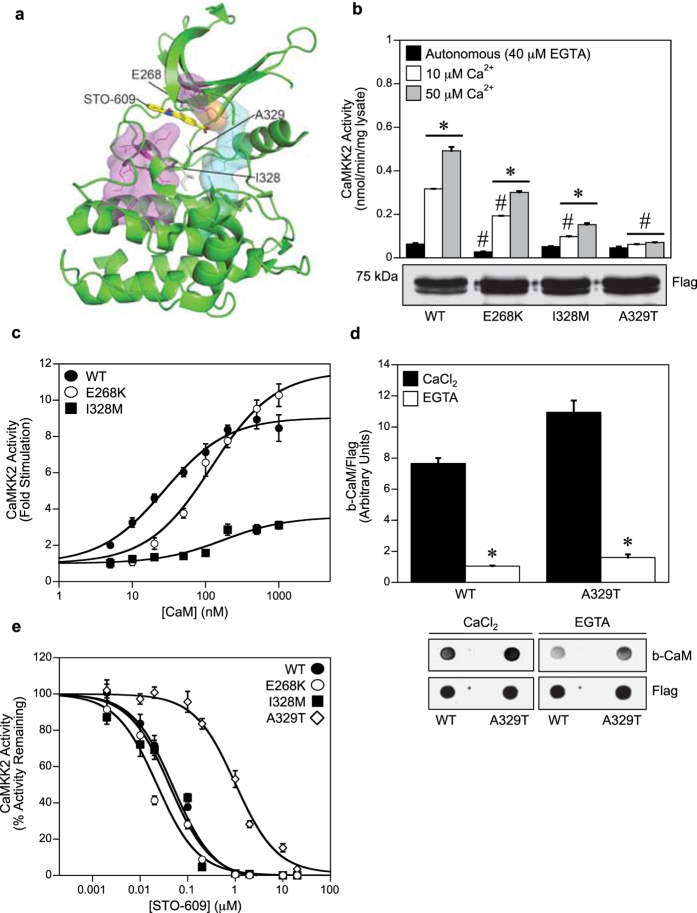
Figure 4. The A329T mutant is insensitive to Ca2+-CaM stimulation.
(a) Structure of the CaMKK2 kinase domain (pdb: 2ZV2), showing the location of the mutants (E268K, I328M, A329T) with respect STO-609 (yellow). Key structural motifs are shown; R-spine (cyan), C-spine (magenta) and the Phe267 gatekeeper residue (orange). (b) Autonomous and Ca2+-CaM stimulated activities of WT and mutant CaMKK2 determined in the presence of 40 μM EGTA, 1 μM CaM, 200 μM ATP and either 10 μM or 50 μM Ca2+. CaMKK2 activity was measured using the CaMKKtide peptide substrate assay and presented as the mean ± SEM; n = 4. The lower panel shows expression levels of WT CaMKK2 and the mutants as determined by immunoblot using a rabbit anti-Flag antibody. (c) Kinase activity of WT and mutant CaMKK2 measured over a range of CaM concentrations (0–1000 nM) in the presence of 50 μM Ca2+. CaMKK2 activity was measured using the CaMKKtide peptide substrate assay and fitted to the equation: Activity = Basal + ((((Fold Stimulation × Basal) − Basal) × [CaM])/(A0.5 + [CaM])), where A0.5 is the concentration of CaM giving half-maximal stimulation. Data are presented as mean ± SEM; n = 4. (d) Overlay analysis of CaM binding to WT and A329T mutant CaMKK2. Binding of biotinylated CaM and total CaMKK2 was visualised using fluorescently-labeled streptavidin and rabbit anti-Flag antibody, respectively. The bar chart shows b-CaM binding (quantified from the overlay), relative to total CaMKK2 protein. Data are presented as mean ± SEM; n = 3. (e) Kinase activity of WT and mutant CaMKK2 measured over a range of STO-609 concentrations (0–20 μM) in the presence of 50 μM Ca2+, 1 μM CaM and 200 μM ATP. CaMKK2 activity is expressed as a percentage of the activity measured in the absence of STO-609, then fitted to the equation: Activity = Minimum Activity + ((Maximal Activity − Minimum Activity)/1 + ([STO-609]/IC50)), where IC50 is the concentration of STO-609 giving half-maximal inhibition. Data are presented as mean ± SEM; n = 4. Statistical analysis was performed by two-way ANOVA. *p < 0.01, vs the control within the same group; #p < 0.01 vs WT within the same treatment.

