
Figure 3. Principle component analysis (PCA) based on Bray-Curtis dissimilarities between all sample sets.
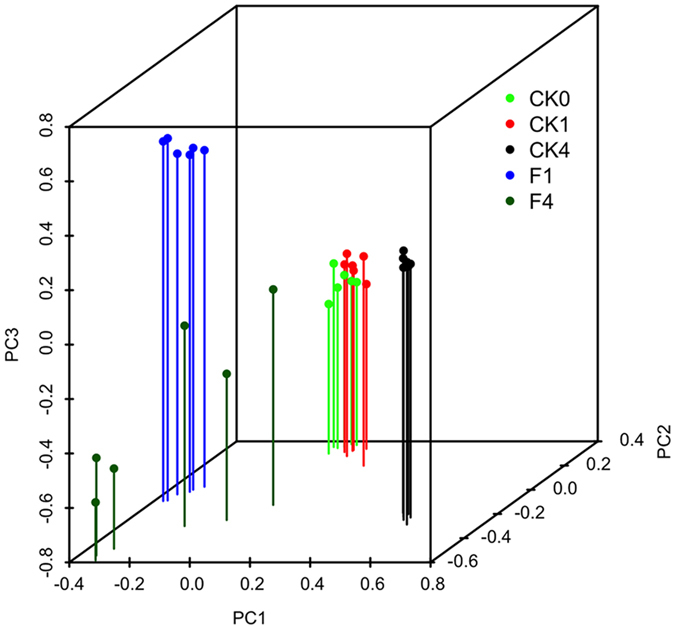
F and CK are fumigation and control treatments, respectively. “0”, “1”, and “4” represent before fumigation, after seedling transplantation and harvest, respectively.