
Figure 5. Heatmap displaying the relative abundances of top 20 fungal genera for all treatments.
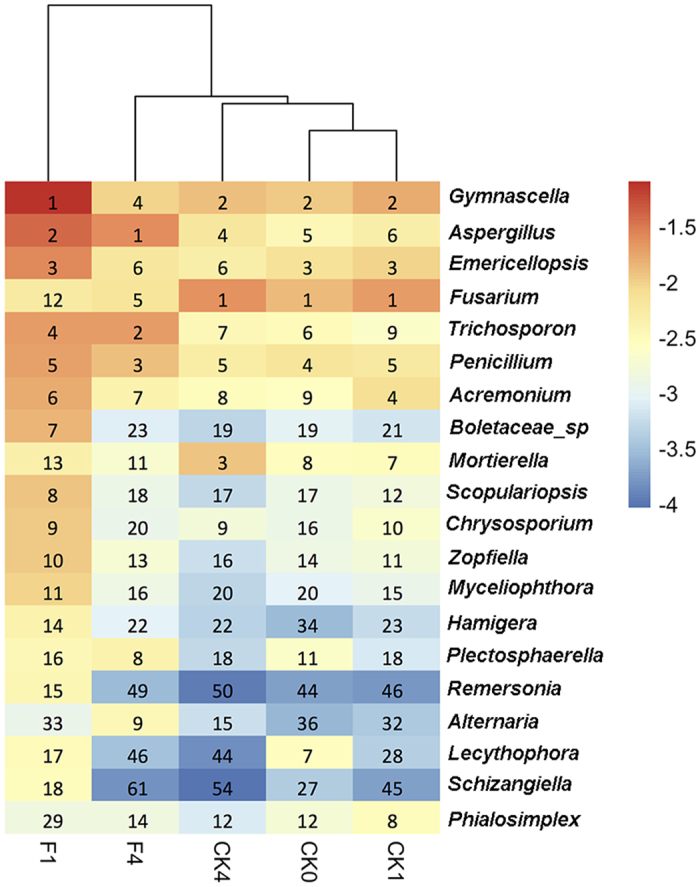
The key from blue to red represents the least abundant to most abundant. The numbers represent the rank of the fungal genera in each treatment sorted from the most abundant to the least abundant genus.