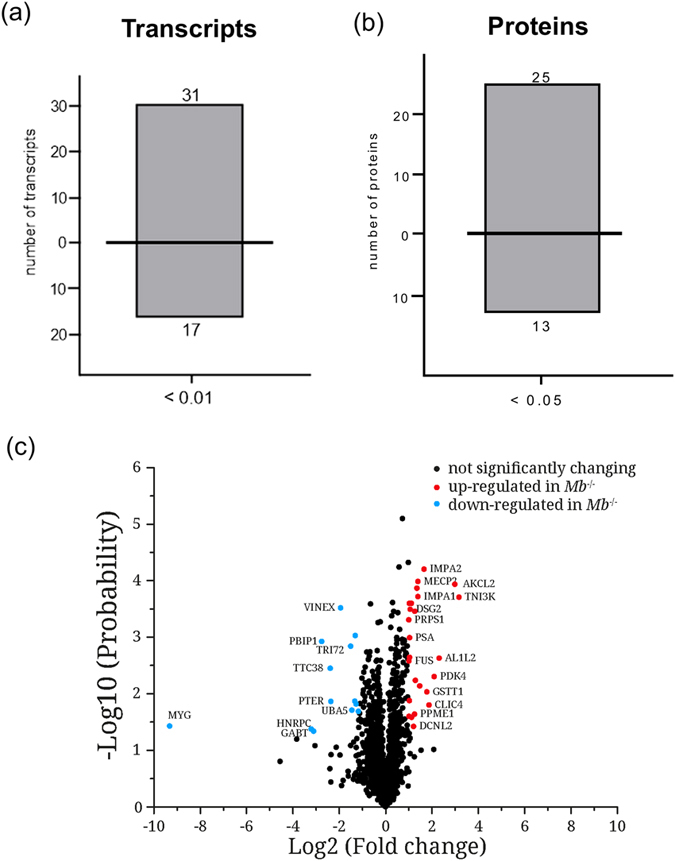
Figure 4. Influence of myoglobin ablation on transcriptome and proteome.

(a) Differentially expressed cardiac transcripts and (b) proteins in wild-type (WT) vs. myoglobin deficient (Mb−/−) mice (Values are mean ± SD, p < 0.01 and p < 0.05, n = 3). (c) Volcano plot of 1884 quantified proteins. Red dots classify significantly up- and light blue dots significantly down-regulated proteins in myoglobin-deficient (Mb−/−) mouse hearts compared to wild-type (WT) mouse hearts. Black dots reflect no significantly changes (n = 3).
