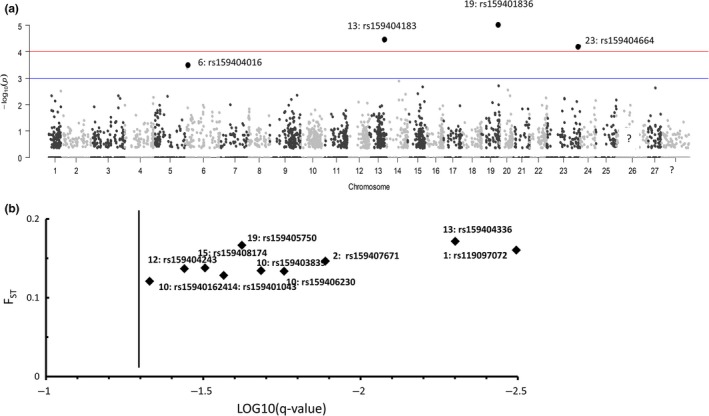
Figure 1.

Detection of outlier loci putatively under diversifying selection within five different groups of the SJR Aquaculture strain and one wild group from the Tobique River (2009PO_AQUA, 2010PG_AQUA, 2011PG_AQUA, 2011PGN_AQUA, 2012PG_AQUA, and TOB_WILD). (a) Locus distribution on a continuous‐chromosome nonhierarchical Arlequin 3.5 analysis. The solid blue line represents the −log10(p) = 2 (p = .001). The solid red line corresponds to the −log10(p) = 3 (p = .0001) (see Appendix S1 for outlier loci numbers and official names of SNPs on chip). (b) Ten outlier loci by BayeScan 2.1 (Foll & Gaggiotti, 2008). The F ST estimates are plotted against the false discovery rate (q‐values). Loci to the left of the solid black line that correspond to the q = 0.05 are significant outliers (see Appendix S2 for outlier loci numbers and official names of SNPs on chip)
