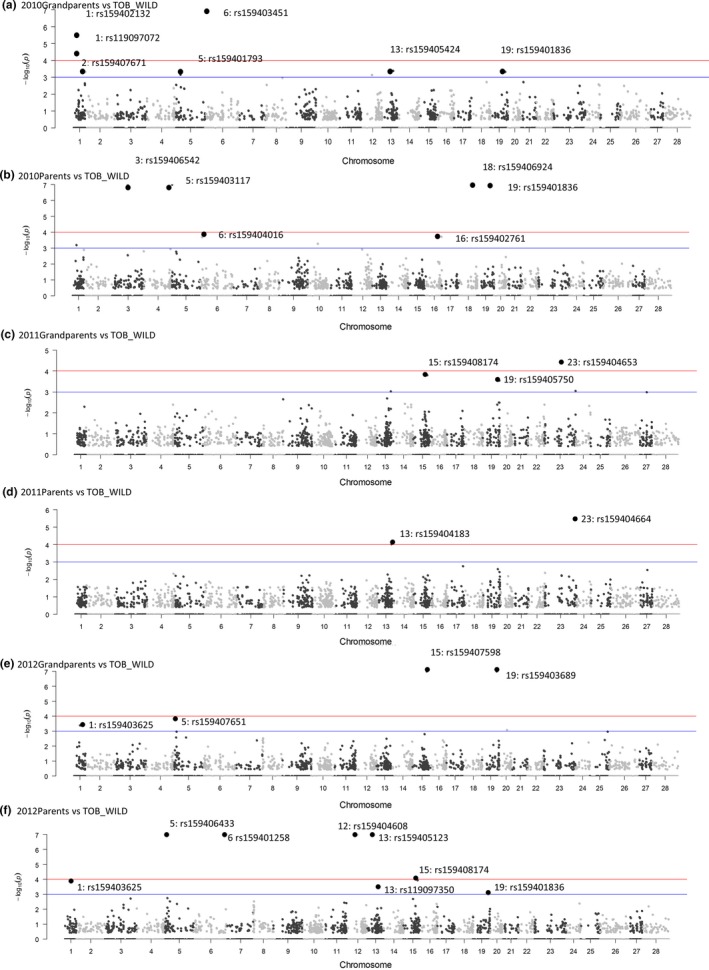
Figure 2.

Locus distribution on a continuous chromosome for pairwise comparisons of six different generations of the AQUA population versus TOB_WILD population. The solid blue lines represent the −log10(p) = 2 (p = .001). The solid red lines correspond to the −log10(p) = 3 (p = .0001). Detailed results in Appendix S3
