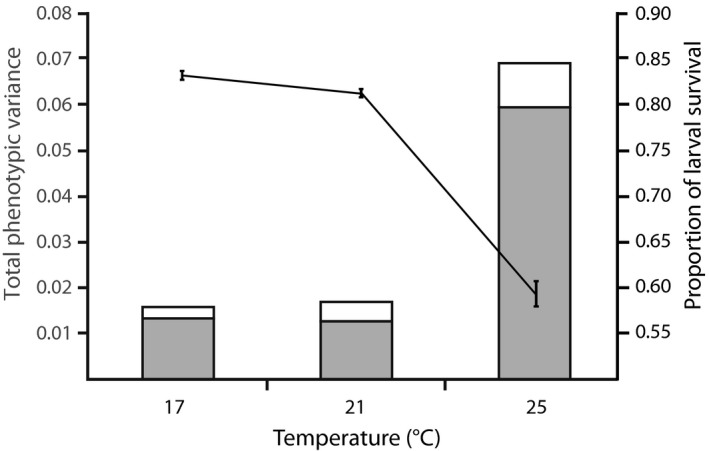
Figure 2.

The left axis and columns show the amount of phenotypic variance in larval survival explained by parental effects (summed across additive genetic, nonadditive genetic and maternal environmental effects, in black) relative to unexplained variance (white) in at each temperature. The right axis and gray line show the mean survival (±SE) of larvae at each temperature.
