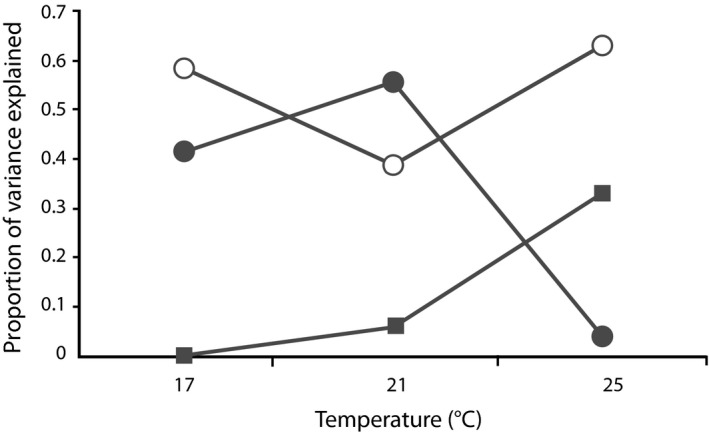
Figure 3.

The relative proportions of the total phenotypic variance in larval survival explained by each source of parental effect: additive genetic effects (gray circles), nonadditive genetic effects (white circles), and maternal environmental effects (gray squares).
