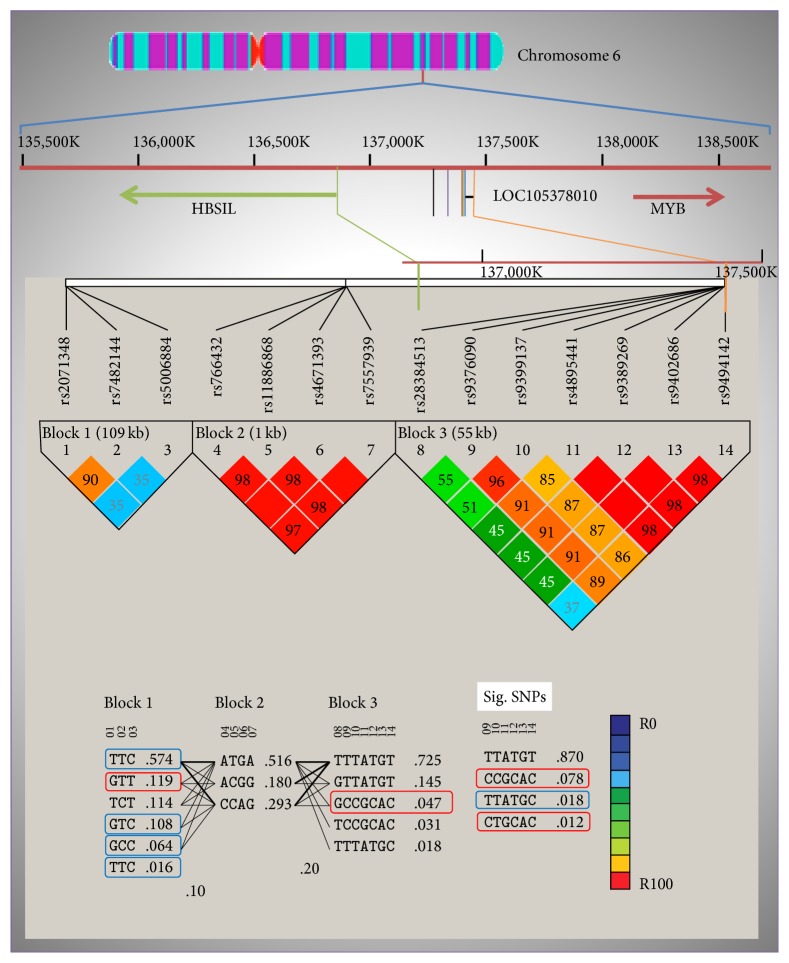
Figure 1.
Linkage disequilibrium (LD) analysis patterns between 3 HBG2, 4 BCL11A, and 7 HBS1L-MYB SNPs compared in thalassemia patients against control cohort. The figure illustrates the chromosome 6 loci inhabiting the seven HBS1L-MYB interregion SNPs outlining the chromosomal location, SNP ID, and the positions that were genotyped in this study. HaploView output of LD across 14 SNPs from the genotyping data in Saudi population. The pairwise correlation between the SNPs was measured as r2 and shown (×100) in each diamond. Enhancer haplotypes are in red boxes and diminisher haplotypes are in blue boxes. Coordinates are according to the NCBI build dbSNP 144 Homo sapiens annotation release 107 (reference sequence NT_025741.16). Sig. SNPs: haplotypes of significant SNPs.

