Figure 1.

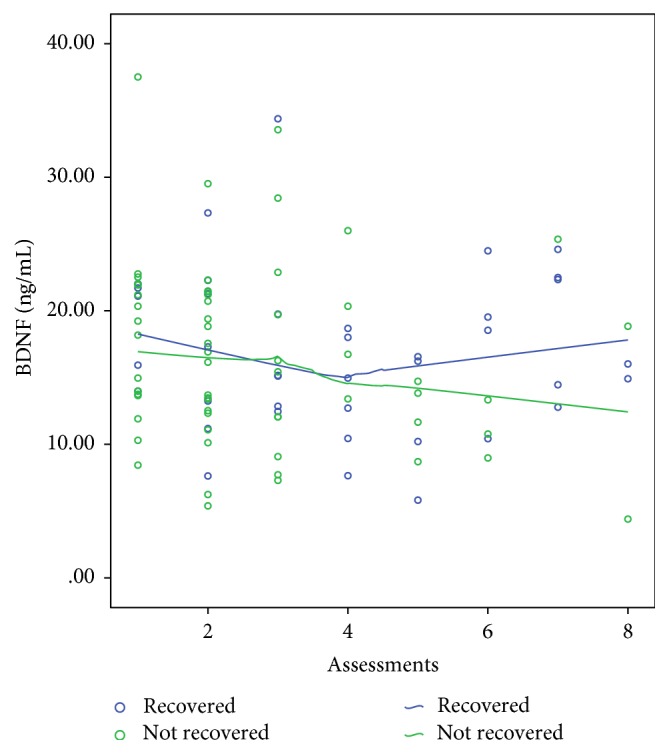
BDNF levels: scatterplot of levels of BDNF across the time between those who recovered from delirium and those who did not. Fitted lines with Loess Kernel Epanechnikov method (90% points fitted).

BDNF levels: scatterplot of levels of BDNF across the time between those who recovered from delirium and those who did not. Fitted lines with Loess Kernel Epanechnikov method (90% points fitted).