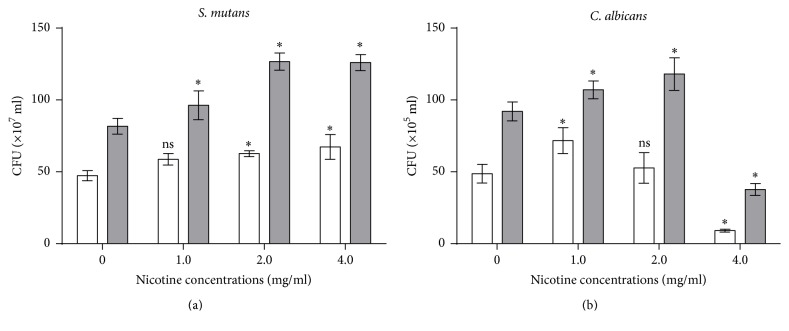
Figure 2.
The number of colony-forming units (CFU) per biofilm at different nicotine concentrations (0, 1, 2, and 4 mg/ml). The white bars indicate single-species biofilms, and the grey bars indicate dual-species biofilms. Asterisks indicate the statistical differences compared to the 0 mg/ml nicotine control. The error bars indicate the standard deviation (SD). ∗P < 0.05 and ns: no significance.

