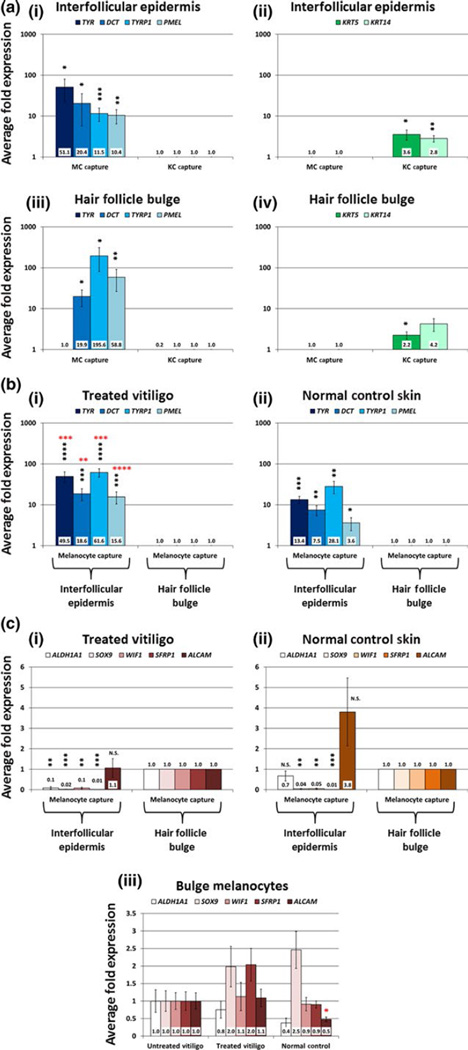
FIGURE 3.
qRT-PCR analysis of melanocyte (MC) and keratinocyte (KC) samples from fluorescent laser capture microdissection (F-LCM). Panel a: F-LCM samples of 100 MC and 100 KC from the interfollicular epidermis and hair follicle bulge of 6 NBUVB-treated vitiligo patients were amplified using the Ovation RNA-Seq System V2 (NuGEN Technologies) and subjected to qRT-PCR analysis. MC-specific genes (a-i, iii; blue bars) were significantly enriched in the MC samples compared to the KC samples, while KC-specific genes (a-ii, iv; green bars) exhibited significantly higher expression in the KC capture compared to MC capture in both regions tested. To illustrate enrichment for MC genes, fold changes for MC genes were set to 1 in KC samples from each region and were compared with expression values in the MC samples (blue bars). Similarly, to show enrichment of KC genes in KC samples, fold changes for KC genes were set to 1 in MC samples from each region and were compared with expression values in the KC samples (green bars). Data shown in logarithmic scale. Panel b: F-LCM samples of 100 MC from the interfollicular epidermis and hair follicle bulge of 7 NBUVB-treated vitiligo patients (b-i) and 6 normal control patients (b-ii) were amplified using the Arcturus RiboAmp HS PLUS Kit Termo Fisher Scientific and subjected to qRT-PCR analysis of MC-specific genes. Fold changes were set to 1 for MC samples from the bulge and were compared with expression values in the interfollicular epidermis within each skin type (blue bars). MC-specific genes (TYR, DCT, TYRP1 and PMEL) showed significantly higher expression (black stars) in MC samples from the interfollicular epidermis compared to MC samples from the bulge within each skin type. In the interfollicular epidermis, all MC-specific genes showed significantly higher expression (red stars) in MC samples from treated vitiligo compared to MC samples in normal control skin. Data shown in logarithmic scale. Panel c: The same F-LCM samples from 7 NBUVB-treated vitiligo patients (c-i) and 6 normal control patients (c-ii) were subjected to qRT-PCR analysis of genes associated with stem cells and the hair follicle bulge. c-i— In the NBUVB-treated vitiligo skin, 4 of the 5 tested melanocytic stem cell genes were expressed at significantly lower levels in the epidermis as compared to the bulge. ALCAM transcript’s expression did not show significant variation in the NBUVB-treated epidermis vs treated bulge. c-ii— In the normal control skin, 3 of the 5 melanocytic stem cell genes transcripts (SOX9, WIF1, SFRP1) showed significantly reduced expression levels in the interfollicular epidermis, as compared to the bulge. Both ALCAM and ALDH1A1 transcripts expression did not exhibit a significant difference between interfollicular epidermis and bulge. Fold changes were set to 1 for MC samples from the bulge and were compared with reduced expression values in the interfollicular epidermis within each skin type. All panels: *P<0.05; **P<0.01; ***P<0.001; ****P<0.0001. c-iii— In the bulge, the expression values for all five melanocytic stem cell genes transcripts tested (ALDH1A1, SOX9, WIF1, SFRP1 and ALCAM) did not vary significantly between interfollicular epidermis of treated vitiligo, untreated vitiligo and normal control skin (one-way ANOVA, Tukey’s post hoc test: adjusted P>0.05 for all pairwise comparisons). Fold changes were set to 1-fold in untreated vitiligo, as compared to treated vitiligo and normal control skin.

