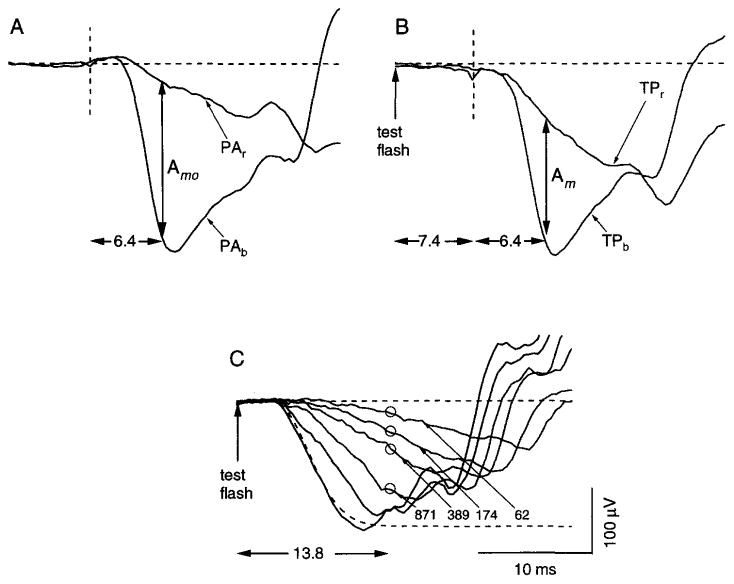
Fig. 5.
Paired-flash determination of the rod response amplitude with short interflash interval and a relatively strong test flash. Data obtained from a single subject. (A) Responses to the blue probe alone (PAb) and the red probe alone (PAr). Here and in (B), the dashed vertical line is the time of probe flash presentation. The difference between the two responses 6.4 msec after flash presentation (vertical arrow) is taken as Amo, the maximal amplitude of the rod-mediated probe response. (B) Responses obtained in two paired-flash trials, each of which involved presentation of a test flash (174 sc td-sec) and, 7.4 msec later (vertical dashed line), a bright probe flash. The probe used in trial TPb was a bright blue flash; that used in trial TPr was a photopically matched red flash. The difference between the two responses 6.4 msec after probe flash presentation (vertical arrow) was taken as the amplitude Am of the rod-mediated probe response. (C) Rod-mediated a-wave responses to test flashes that ranged from 62 to 3.5 × 10³ sc td-sec. The dashed curve represents the fit of a computational a-wave model to the response at 3.5 × 10³ sc td-sec. Circles indicate paired-flash determinations of A/Amo at the post-test-flash time of 13.8 msec, obtained for the 174-sc td-sec test flash as described in (B), and similarly obtained for test flashes of 62, 389, and 871 sc td-sec. For illustration with the a-wave data, the value of Amo was equated with the maximal excursion predicted by the a-wave model (asymptote of dashed curve). See text for further details.

