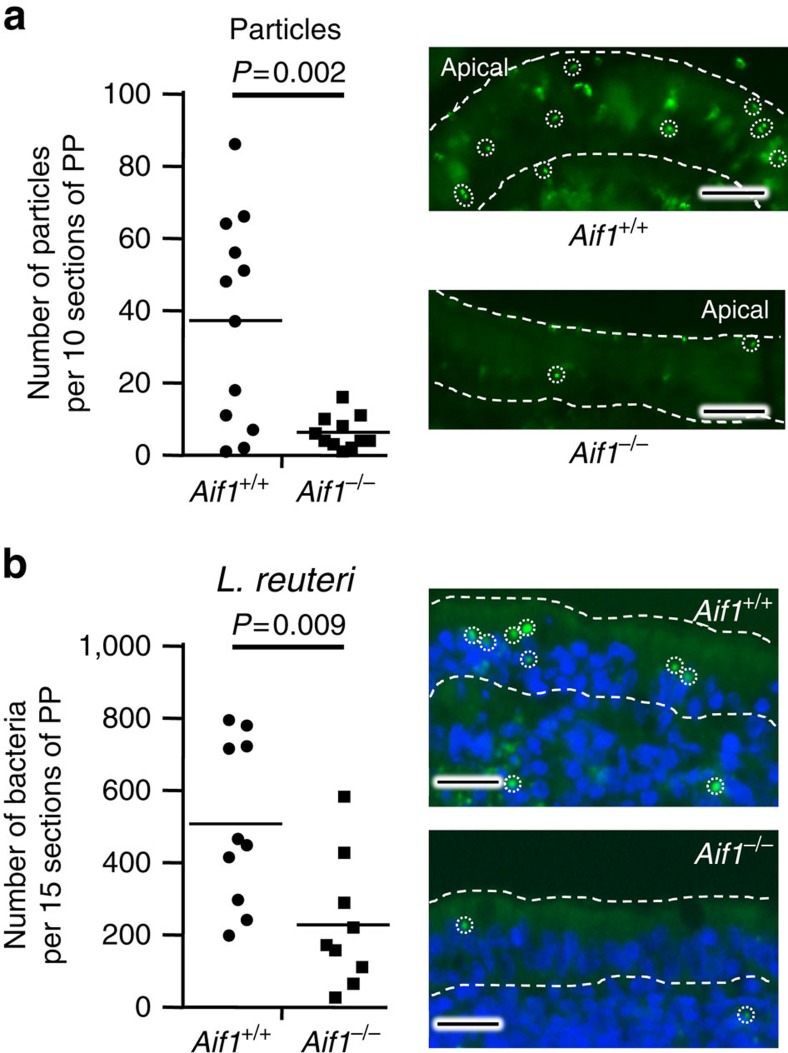
Figure 4. Influence of Aif1 deficiency on transcytosis function of M cells.
Evaluation of particle (a) and Lactobacillus reuteri (b) sampling by M cells. Mice fasted for 24 h were given fluorescence-conjugated 200 nm particles (1 × 10¹¹ beads) or FITC-labelled bacteria (5 × 10⁹ CFUs) orally. Two hours later, PPs were collected from the duodenum, fixed in 4% paraformaldehyde, and cut into 10 or 15 consecutive sections. The numbers of particles or labelled bacteria that had entered each PP were then counted under a fluorescence microscope. Each dot represents an individual PP from three independent experiments (For particles: Aif1+/+, n=12; Aif1−/−, n=11. For L. reuteri: Aif1+/+, n=10; Aif1−/−, n=9). Horizontal bars indicate each mean. P values were determined with Student's t-test. Right panels are representative images of each section. Dotted lines indicate FAE regions and circles indicate each particle or bacterium. Scale bar, 20 μm.

