
Fig. 1.—
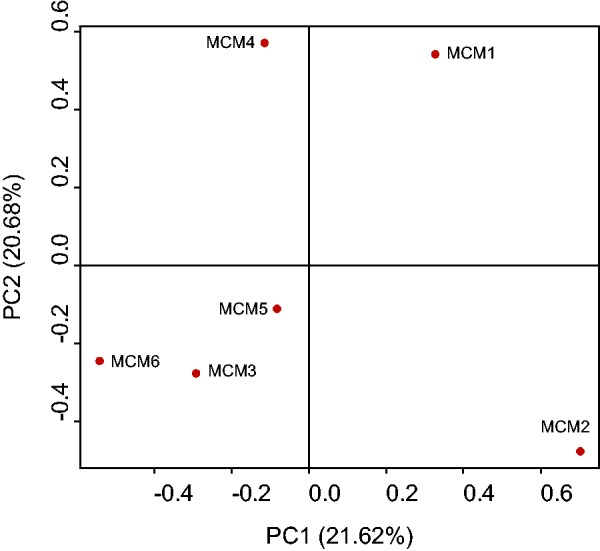
PCA plot of the six Mauritian cynomolgus macaque individuals. The individual ID is given beside each data point. The x- and y-axes represent the first and second principal components, respectively.
Official websites use .gov
A
.gov website belongs to an official
government organization in the United States.
Secure .gov websites use HTTPS
A lock (
) or https:// means you've safely
connected to the .gov website. Share sensitive
information only on official, secure websites.
PCA plot of the six Mauritian cynomolgus macaque individuals. The individual ID is given beside each data point. The x- and y-axes represent the first and second principal components, respectively.